
Toyo Tanso (TSE:5310) Nears Analyst Targets, Is The Stock Overvalued?
Why Toyo Tanso Is On Investors’ Radar
Toyo Tanso (TSE:5310) has drawn fresh attention after a solid recent run, with the stock closing at ¥7,880 and showing strong multi period returns that frame today’s valuation questions for shareholders.
Recent trading has added fuel to that conversation. Toyo Tanso’s share price return of 13.38% over the past month and 62.31% year to date points to building momentum, while a 5 year total shareholder return of 206.57% shows how long term holders have been rewarded.
Scan the market for stocks that exhibit Toyo Tanso like momentum and financial resilience with our hand picked 12 high quality undervalued stocks.
The move to ¥7,880 has brought Toyo Tanso close to analyst targets, yet the stock still trades at a discount to some fair value estimates. Is the market’s caution grounded in something real, or is it now lagging the story?
Price-to-Earnings of 37.1x: Is It Justified For Toyo Tanso?
Toyo Tanso now trades on a P/E of 37.1x, a level that sits well above both its local Electrical industry and peer averages even after the strong share price run to ¥7,880.
The P/E ratio compares the current share price to earnings per share and effectively shows how many years of profit the market is willing to pay for. For a specialist carbon materials producer exposed to semiconductors, renewable energy, and nuclear related demand, investors often look at this gauge to understand how much future earnings strength is already embedded in the price.
Current forecasts point to earnings growth of 21.83% per year and revenue growth of 11.7% per year, which helps explain why the market is assigning a richer multiple. At the same time, Toyo Tanso’s Return on Equity is 4.6%, which is described as low, and profit margins have moved from 15% to 9.8% according to the latest data. That mix of high expected growth but modest profitability suggests a valuation level the market could reassess if either the growth or margin profile changes.
Compared to the JP Electrical industry average P/E of 14x, Toyo Tanso’s 37.1x earnings multiple is described as expensive. The same conclusion holds against its peer group, where the average is 14.5x, and against an estimated fair P/E of 21.4x, which implies a much lower level that the market could move towards if sentiment cools.
Explore the SWS fair ratio for Toyo Tanso.
Result: Price-to-Earnings of 37.1x (OVERVALUED)
Still, Toyo Tanso’s rich 37.1x P/E and thinner 9.8% profit margin leave little room for disappointment if demand in key end markets softens.
Find out about the key risks to this Toyo Tanso narrative.
Another View On Toyo Tanso’s Value
There is a very different message coming from our DCF model. At ¥7,880, Toyo Tanso trades well above an estimated future cash flow value of ¥3,101.63, which screens as overvalued. That gap hints at downside risk if cash generation does not match the current optimism.
Look into how the SWS DCF model arrives at its fair value.
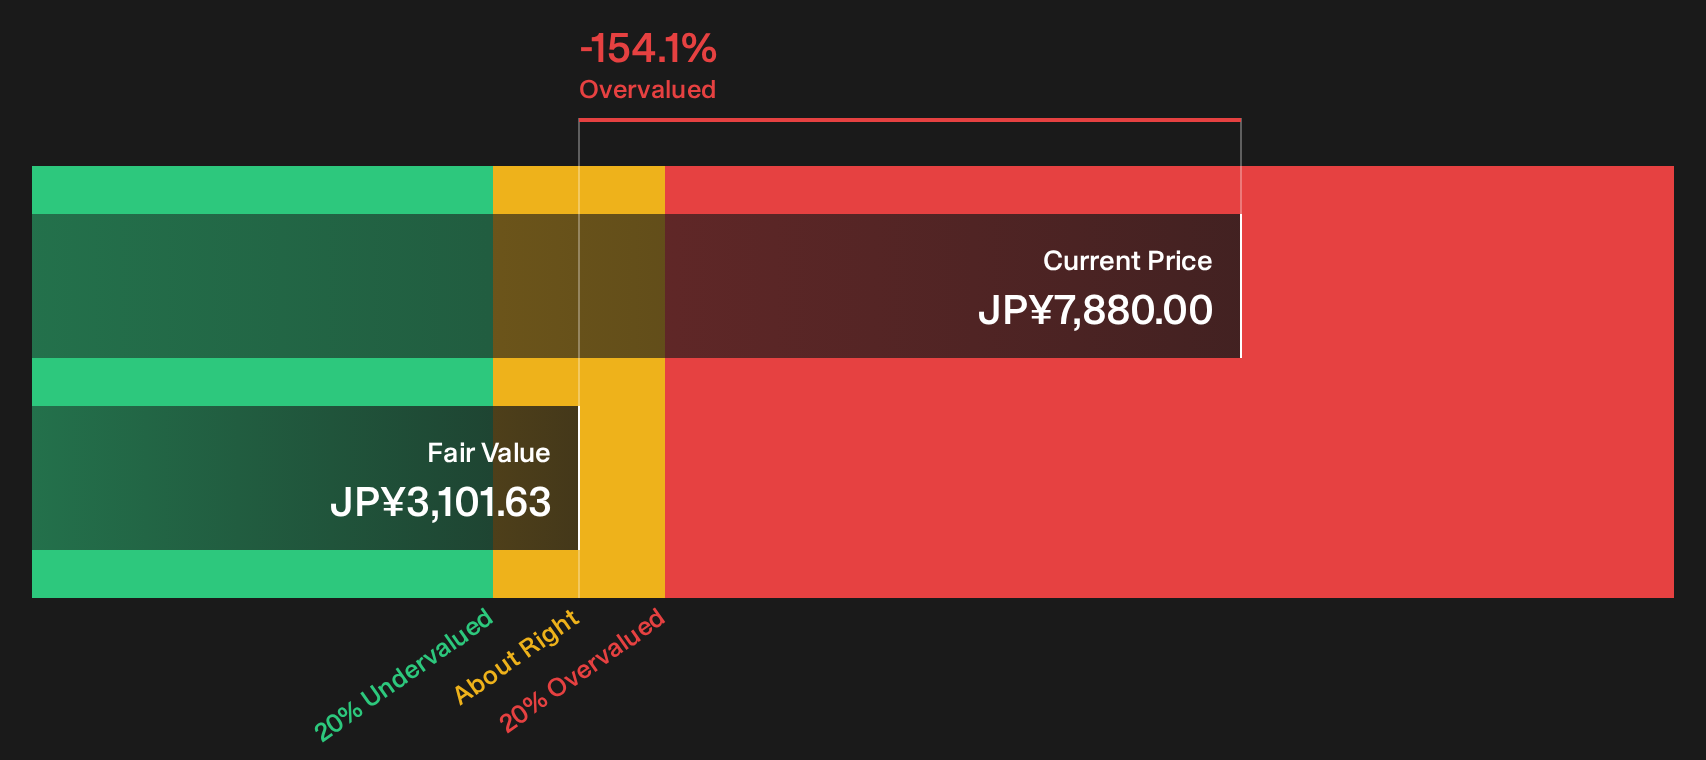
Simply Wall St performs a discounted cash flow (DCF) on every stock in the world every day (check out Toyo Tanso for example). We show the entire calculation in full. You can track the result in your watchlist or portfolio and be alerted when this changes, or use our stock screener to discover 12 high quality undervalued stocks. If you save a screener we even alert you when new companies match - so you never miss a potential opportunity.
Next Steps
If this mix of strong recent returns and richer multiples around Toyo Tanso leaves you on the fence, that is the right instinct. Move quickly from reading to checking the numbers yourself, then weigh the 1 key reward and 3 important warning signs.
Looking For More Investment Ideas Beyond Toyo Tanso?
If Toyo Tanso has sharpened your focus on valuation and quality, do not stop here. Broaden your watchlist using focused stock ideas from the Simply Wall Street Screener.
- Spot potential turnaround stories by reviewing carefully selected smaller opportunities through the 1 elite penny stocks with strong financials.
- Target quality at a reasonable price by scanning for stronger businesses on the 74 high quality undiscovered gems.
- Dial down portfolio risk by filtering for sturdier balance sheets with the list of solid balance sheet and fundamentals (23 results).
This article by Simply Wall St is general in nature. We provide commentary based on historical data and analyst forecasts only using an unbiased methodology and our articles are not intended to be financial advice. It does not constitute a recommendation to buy or sell any stock, and does not take account of your objectives, or your financial situation. We aim to bring you long-term focused analysis driven by fundamental data. Note that our analysis may not factor in the latest price-sensitive company announcements or qualitative material. Simply Wall St has no position in any stocks mentioned.
Have feedback on this article? Concerned about the content? Get in touch with us directly. Alternatively, email editorial-team@simplywallst.com