
Italmobiliare (BIT:ITM) Slides Again On Conflicting Value Signals
Italmobiliare (BIT:ITM) slipped again on Thursday, closing at €24.95, as the holding group’s share price continued a weaker trend over the past month and the past 3 months.
Recent trading has been weak for Italmobiliare, with the 90-day share price return down 14.11% and the year-to-date move lower by 11.99%. The 1-year total shareholder return has fallen 20.94%, even though the 3-year total shareholder return remains positive at 21.42%.
Compare Italmobiliare’s recent share price slide with other companies that combine solid balance sheets and fundamentals by scanning our hand picked list of solid balance sheet and fundamentals (205 results) today.
Italmobiliare now trades well below both analyst targets and an estimated fair value, even as recent returns have turned sharply lower. Is that a genuine margin of safety, or is the market flagging real risks around the portfolio and earnings mix?
Preferred P/E of 16.5x: Is it justified?
For Italmobiliare, the current P/E of 16.5x sits slightly below the wider Italian market on 17x, and also below the European Industrials average of 17.7x, while the share price trades at €24.95. That combination suggests the stock is priced at a discount to both its domestic market and its industry peers based on earnings.
The P/E multiple compares what investors are paying today for each euro of profit. It helps you see how the market is weighing the earning power of the holding group. Because Italmobiliare runs a diversified portfolio across coffee, cosmetics, specialty healthcare, renewable energy and other activities, a mid-teens P/E often reflects a mix of mature and growth-oriented assets rather than a pure high growth profile.
The share price is described as good value not only versus the European Industrials average of 17.7x but also against a peer group on 33.5x, which is a much richer earnings multiple. In addition, a fair P/E estimate of 17.8x is higher than the current 16.5x, which indicates that if the market shifted closer to this fair ratio, the valuation level could move higher relative to current pricing.
Explore the SWS fair ratio for Italmobiliare.
Result: Price-to-Earnings of 16.5x (UNDERVALUED)
Still, Italmobiliare faces real pressure points if sentiment shifts further, including potential earnings volatility across its varied portfolio and any renewed weakness in key consumer exposed businesses.
Find out about the key risks to this Italmobiliare narrative.
Another View: DCF Says Italmobiliare Is Expensive
The P/E ratios present Italmobiliare as attractively priced, yet the SWS DCF model comes to a very different conclusion. On that future cash flow view, an estimated value of €13.03 per share sits well below the current €24.95 level. That implies limited cushion if cash generation disappoints.
Investors who want to see how this more conservative lens is built can Look into how the SWS DCF model arrives at its fair value.
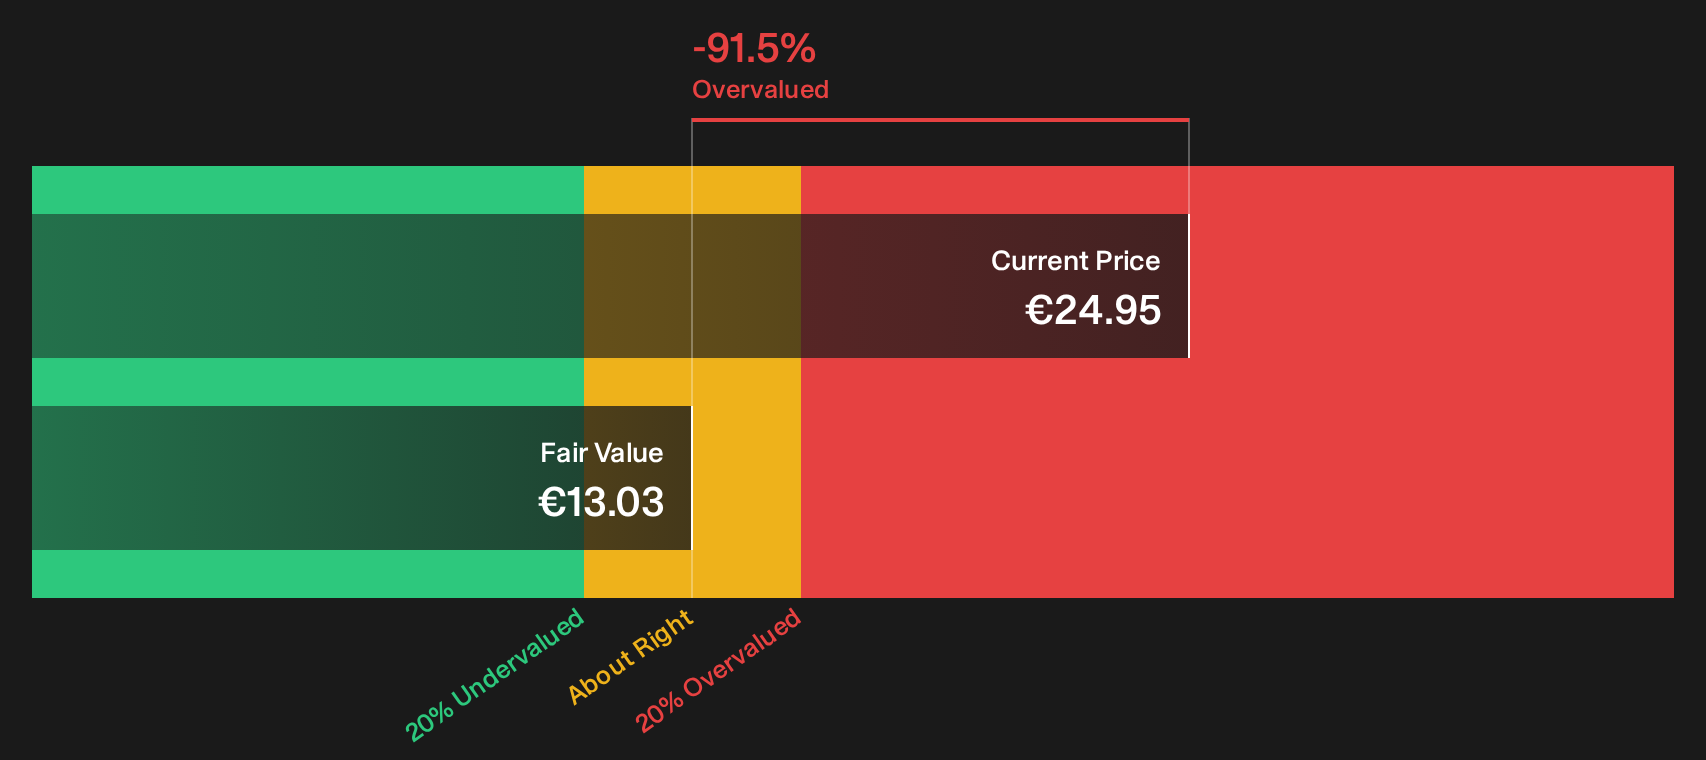
Simply Wall St performs a discounted cash flow (DCF) on every stock in the world every day (check out Italmobiliare for example). We show the entire calculation in full. You can track the result in your watchlist or portfolio and be alerted when this changes, or use our stock screener to discover 179 high quality undervalued stocks. If you save a screener we even alert you when new companies match - so you never miss a potential opportunity.
Next Steps
If this mix of signals around Italmobiliare feels conflicting, the next move is to move quickly, test the data yourself and decide where you land. To weigh both sides of the story in one place, start with the 5 key rewards and 1 important warning sign.
Looking for more Italmobiliare investment ideas?
Before closing the book on Italmobiliare, consider broadening your options. The right watchlist often comes from looking beyond a single stock and testing fresh ideas.
- Target resilient potential by scanning 225 resilient stocks with low risk scores to help keep downside in check when conditions turn harder.
- Spot potential value candidates early by reviewing 619 high quality undiscovered gems that pair solid fundamentals with relatively limited market attention.
- Build a sturdier core for your portfolio by filtering for companies on the 224 dividend fortresses that focus on higher yields backed by robust profiles.
This article by Simply Wall St is general in nature. We provide commentary based on historical data and analyst forecasts only using an unbiased methodology and our articles are not intended to be financial advice. It does not constitute a recommendation to buy or sell any stock, and does not take account of your objectives, or your financial situation. We aim to bring you long-term focused analysis driven by fundamental data. Note that our analysis may not factor in the latest price-sensitive company announcements or qualitative material. Simply Wall St has no position in any stocks mentioned.
Have feedback on this article? Concerned about the content? Get in touch with us directly. Alternatively, email editorial-team@simplywallst.com