
GNI Group (TSE:2160), What Is Behind The Growing Attention?
Recent trading in GNI Group (TSE:2160) has drawn attention after the share price closed at ¥3,205, with the stock posting mixed short term moves and stronger performance over the past month and past three months.
Over the past year, GNI Group has combined a strong year to date share price return of 39.96% with a 1 year total shareholder return of 37.49%. The recent 30 day share price gain of 9.91% and 90 day return of 23.03% point to building momentum rather than fading enthusiasm around the stock.
Scan other momentum stories in the same spirit as GNI Group with a curated shortlist of 74 high quality undiscovered gems that pair strong recent returns with underlying business traction.
Bulls point to GNI Group’s recent momentum and late stage pipeline assets. Bears focus on ongoing losses and execution risk. Which side does the valuation now lean toward as the price climbs toward ¥3,205?
Preferred Price-to-Sales of 8x for GNI Group: Is it justified?
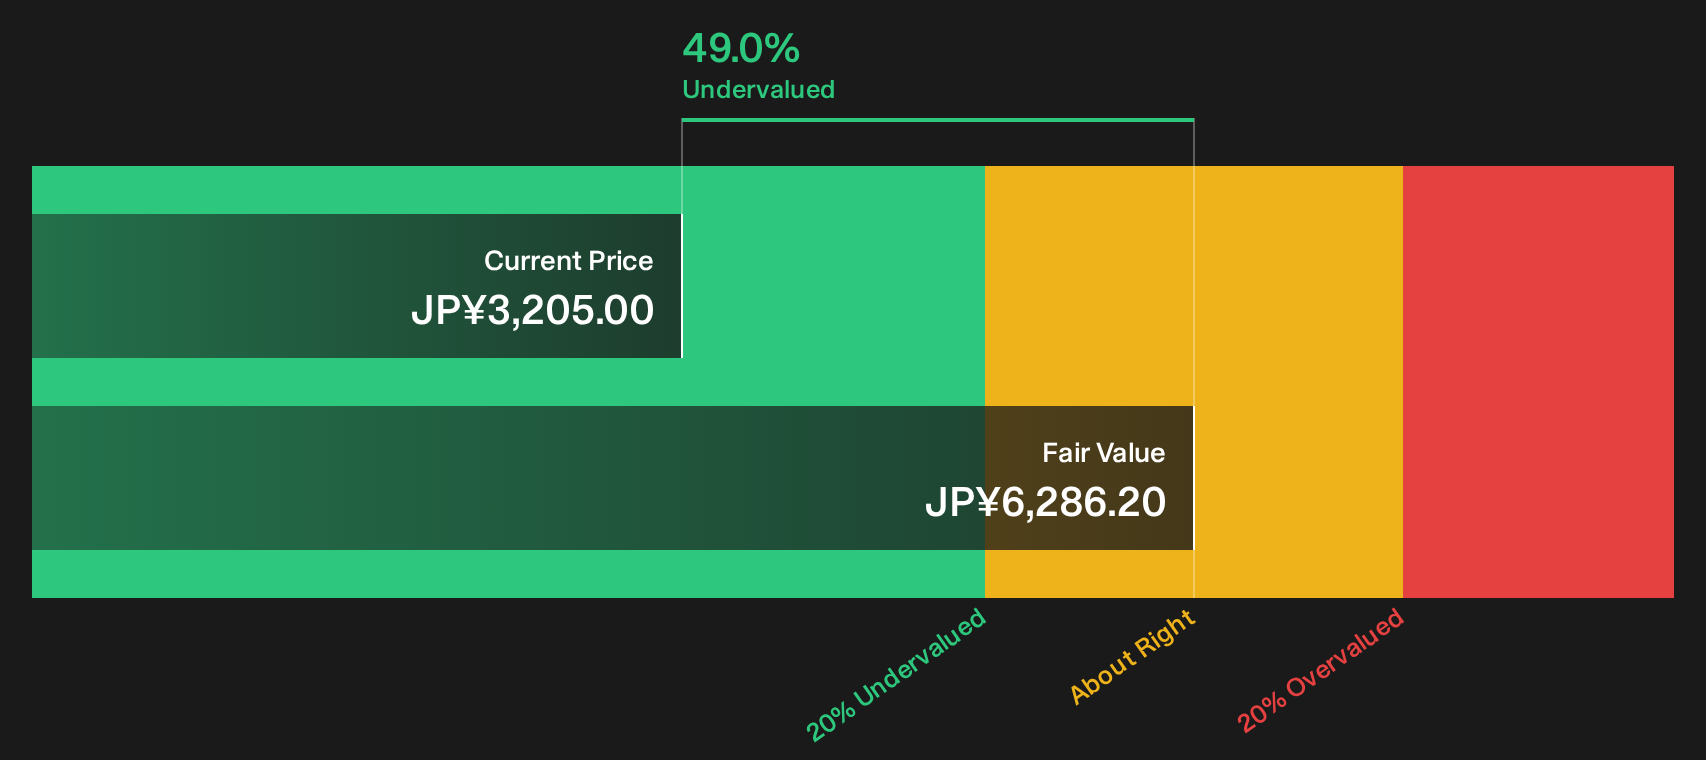
On the numbers alone, GNI Group looks caught between two stories. The SWS DCF model suggests the shares, at ¥3,205, sit well below an estimated future cash flow value of ¥6,286.2, yet the current Price-to-Sales ratio of 8x screens as expensive against an estimated fair P/S of 3.3x.
The P/S ratio compares the market value of the equity to its annual revenue. For a biotech style group like GNI Group, where the business is still loss making and earnings are not a clean guide, investors often use P/S as a rough shorthand for how much the market is paying for each unit of sales tied to the existing product portfolio and pipeline optionality.
There is a wide gap between those valuation markers. The observed 8x P/S looks steep relative to the 3.3x level that the fair ratio work suggests the market could eventually gravitate toward, yet it also sits well below peer and industry averages according to the same dataset. That mix hints at a market that is paying up for the current late stage pipeline and revenue growth forecasts while still leaving room for debate on whether the DCF fair value or the regression based multiple becomes the anchor.
Against the rest of the JP Biotechs space, the contrast is stark. GNI Group trades on an 8x P/S, while the peer group average sits at 11.1x and the broader JP Biotechs industry average sits at 16.5x. That is a material discount to both direct comparables and the wider sector, which suggests investors are attaching a lower sales multiple than is common elsewhere even though the fair P/S estimate points toward a much lower level than all three.
Explore the SWS fair ratio for GNI Group.
Result: Price-to-Sales of 8x (ABOUT RIGHT)
Still, the GNI Group story carries clear pressure points, including ongoing losses of ¥5,317 and heavy reliance on clinical trial progress for future revenue potential.
Find out about the key risks to this GNI Group narrative.
Another View: Our DCF Model Sees GNI Group as Undervalued
On a pure cash flow lens, the story for GNI Group changes. Our DCF model estimates a future cash flow value of ¥6,286.2 per share, almost double the current ¥3,205 price, which suggests the stock may be undervalued rather than stretched.
That kind of gap can signal mispricing, or it can reflect investors discounting execution risk, clinical timelines, and the path to future profits. The key question is whether the current market is being overly cautious about those hurdles or the cash flow model is too optimistic about what actually makes it to the bottom line.
Look into how the SWS DCF model arrives at its fair value.
Simply Wall St performs a discounted cash flow (DCF) on every stock in the world every day (check out GNI Group for example). We show the entire calculation in full. You can track the result in your watchlist or portfolio and be alerted when this changes, or use our stock screener to discover 12 high quality undervalued stocks. If you save a screener we even alert you when new companies match - so you never miss a potential opportunity.
Next Steps
Momentum and valuation currently point in different directions for GNI Group, so do not wait around for consensus to form. Instead, check the data yourself and weigh both the concerns and the potential upside captured in the 2 key rewards and 2 important warning signs.
Looking for more investment ideas beyond GNI Group?
If GNI Group has sharpened your focus on valuation and momentum, do not stop there. Broader idea hunting can help round out your watchlist.
- Target resilient potential by screening for 23 resilient stocks with low risk scores that aim to keep portfolio volatility in check when individual positions move around.
- Hunt for quality at a discount with the 12 high quality undervalued stocks that pairs solid fundamentals with prices the market has not fully rewarded yet.
- Strengthen your foundation by filtering for a list of solid balance sheet and fundamentals (23 results) that can better support operations when conditions turn against more fragile businesses.
This article by Simply Wall St is general in nature. We provide commentary based on historical data and analyst forecasts only using an unbiased methodology and our articles are not intended to be financial advice. It does not constitute a recommendation to buy or sell any stock, and does not take account of your objectives, or your financial situation. We aim to bring you long-term focused analysis driven by fundamental data. Note that our analysis may not factor in the latest price-sensitive company announcements or qualitative material. Simply Wall St has no position in any stocks mentioned.
Have feedback on this article? Concerned about the content? Get in touch with us directly. Alternatively, email editorial-team@simplywallst.com