
Berkshire Hathaway And Two Other Stocks Assessed To Be Trading Below Their Estimated Value
The market has climbed 1.2% in the last 7 days and is up 13% over the last 12 months, with earnings forecast to grow by 18% annually. In this context of steady growth, identifying stocks that are trading below their estimated value can provide opportunities for investors seeking to capitalize on potential future gains.
Top 10 Undervalued Stocks Based On Cash Flows In The United States
| Name | Current Price | Fair Value (Est) | Discount (Est) |
| Zions Bancorporation National Association (ZION) | $62.73 | $121.81 | 48.5% |
| Textron (TXT) | $73.22 | $141.94 | 48.4% |
| TD SYNNEX (SNX) | $267.46 | $521.98 | 48.8% |
| Signet Jewelers (SIG) | $105.89 | $211.23 | 49.9% |
| Pegasystems (PEGA) | $35.49 | $69.59 | 49% |
| KeyCorp (KEY) | $20.10 | $39.74 | 49.4% |
| Insteel Industries (IIIN) | $29.50 | $57.37 | 48.6% |
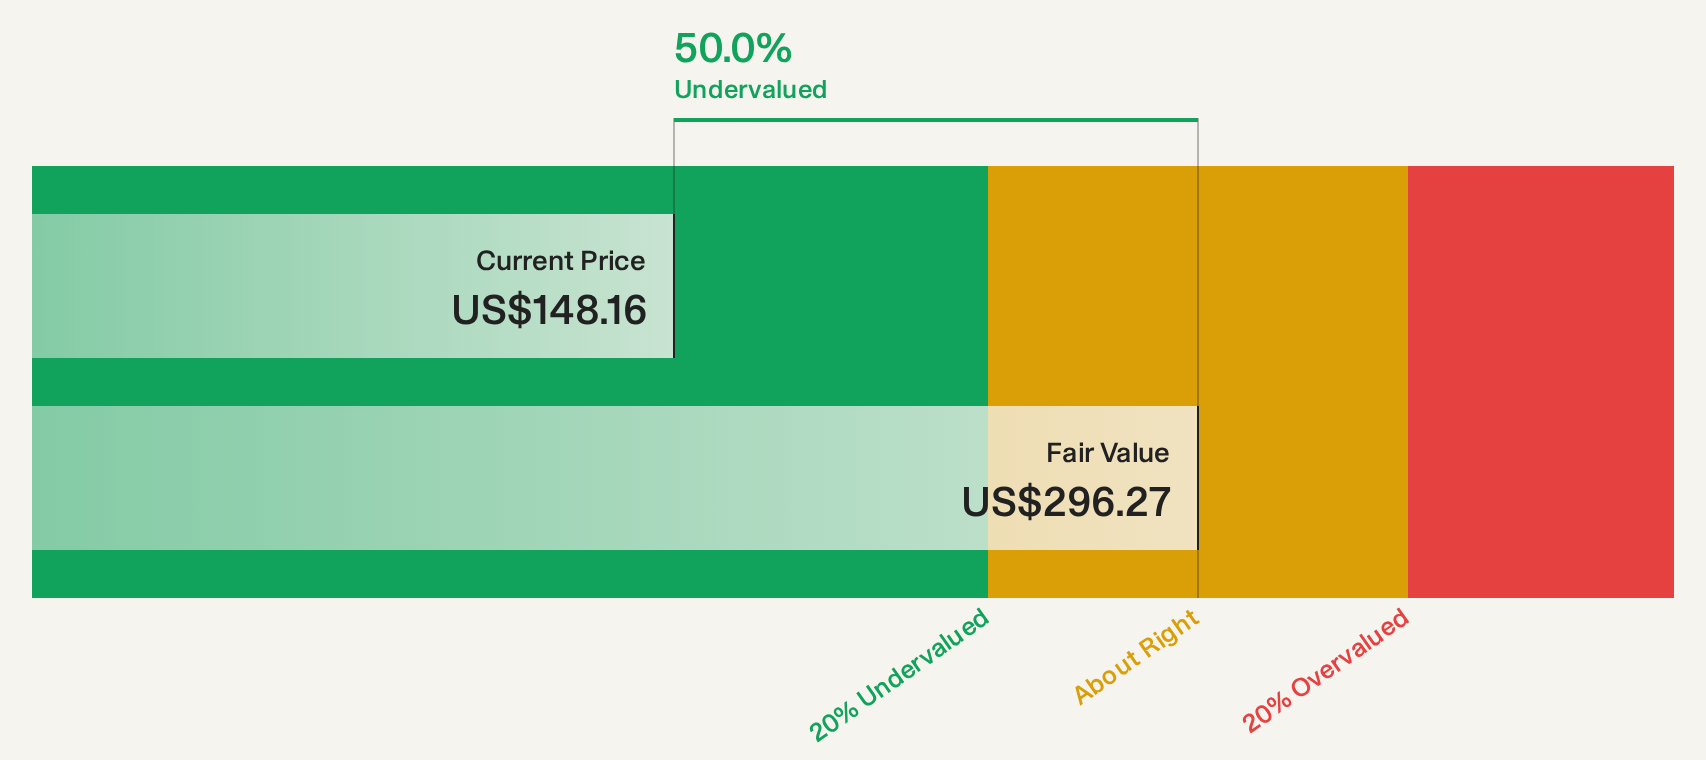
| EOG Resources (EOG) | $148.51 | $296.27 | 49.9% |
| Civista Bancshares (CIVB) | $26.94 | $53.30 | 49.5% |
| Addus HomeCare (ADUS) | $114.26 | $226.18 | 49.5% |
We're going to check out a few of the best picks from our screener tool.
Berkshire Hathaway (BRK.A)
Overview: Berkshire Hathaway Inc., with a market cap of $1.08 trillion, operates through its subsidiaries in insurance, freight rail transportation, and utility businesses.
Operations: The company's revenue segments include BNSF at $24.64 billion, Manufacturing at $82.99 billion, McLane Company at $50.28 billion, Insurance - GEICO at $45.14 billion, Service and Retailing at $44.70 billion, Berkshire Hathaway Energy at $26.92 billion, Pilot Travel Centers (PTC) at $47.84 billion, Insurance - Berkshire Hathaway Primary Group at $18.72 billion, and Insurance - Berkshire Hathaway Reinsurance Group (including General Re) at $25.52 billion.
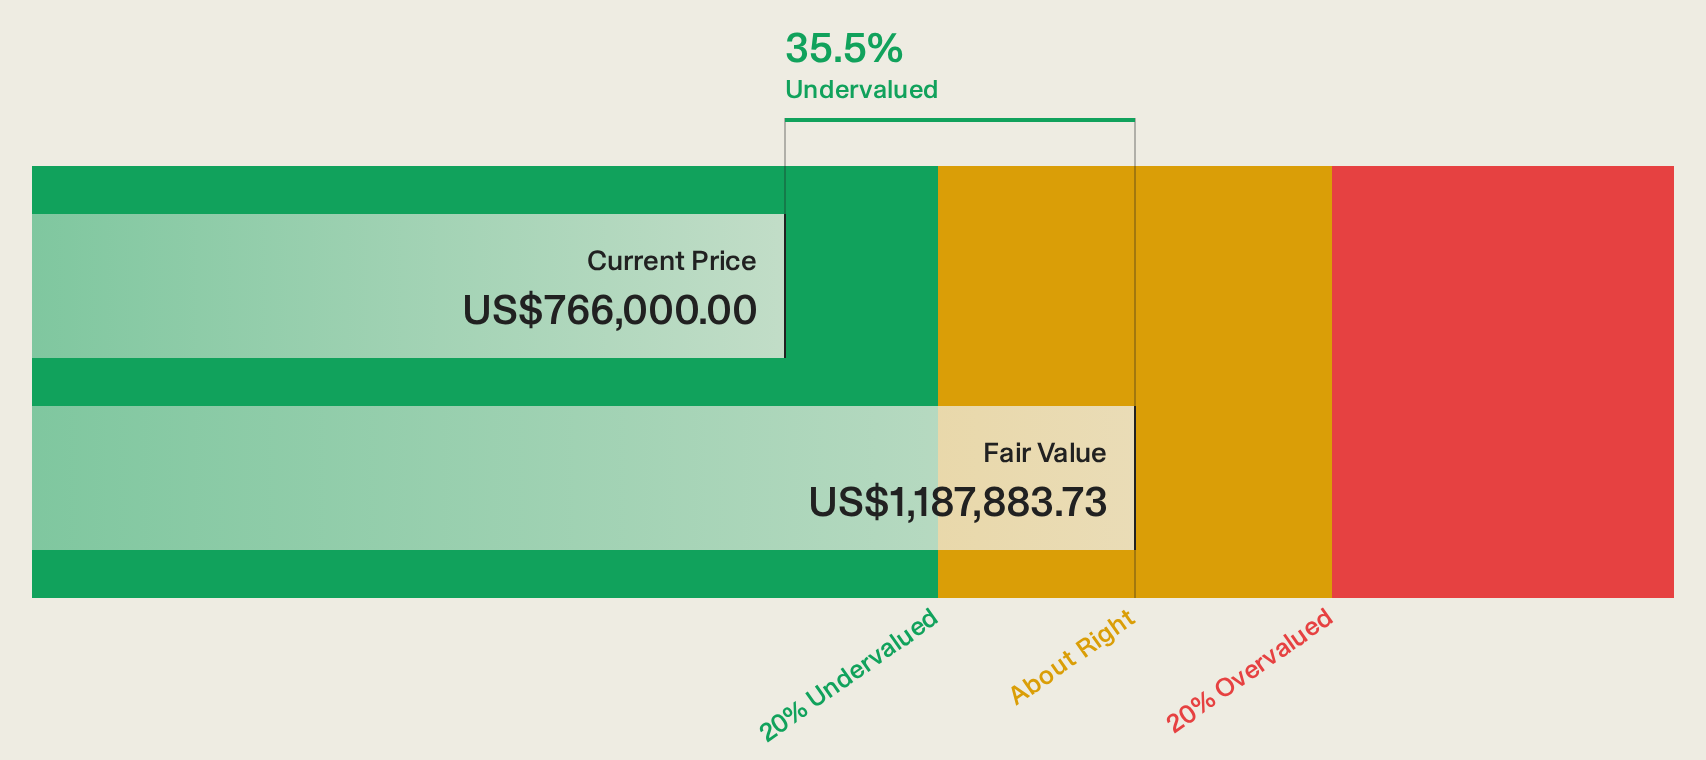
Estimated Discount To Fair Value: 35.1%
Berkshire Hathaway is trading at 35.1% below its estimated fair value and below future cash flow value by over 20%, highlighting its potential undervaluation. Despite a significant earnings growth of 36.3% in the past year, forecasts suggest a decline in earnings by an average of 8.3% annually over the next three years, with revenue growth expected to lag behind the US market at just 4.9%. Recent leadership changes saw Howard G. Buffett appointed as Chairman following Warren Buffett's transition to Chairman Emeritus.
- Upon reviewing our latest growth report, Berkshire Hathaway's projected financial performance appears quite optimistic.
- Click here and access our complete balance sheet health report to understand the dynamics of Berkshire Hathaway.
EOG Resources (EOG)
Overview: EOG Resources, Inc. is engaged in the exploration, development, production, and marketing of crude oil, natural gas liquids, and natural gas across various producing basins in the United States and internationally, with a market cap of approximately $75.64 billion.
Operations: The company's revenue is primarily derived from its crude oil and natural gas exploration and production segment, totaling $26.72 billion.
Estimated Discount To Fair Value: 49.9%
EOG Resources is trading at 49.9% below its fair value estimate and significantly under future cash flow value, suggesting potential undervaluation. Despite impressive revenue and net income growth in recent quarters, forecasts indicate a decline in earnings by 1.8% annually over the next three years. The company recently announced executive changes with Jeffrey Hibbard set to become CFO in January 2027, which may impact strategic financial decisions moving forward.
- The growth report we've compiled suggests that EOG Resources' future prospects could be on the up.
- Click here to discover the nuances of EOG Resources with our detailed financial health report.
Northrop Grumman (NOC)
Overview: Northrop Grumman Corporation is an aerospace and defense technology company with operations in the United States, Asia/Pacific, Europe, and internationally, boasting a market cap of approximately $67.26 billion.
Operations: The company's revenue is primarily derived from four segments: Aeronautics Systems at $13.87 billion, Mission Systems at $12.65 billion, Space Systems at $10.79 billion, and Defense Systems at $8.20 billion.
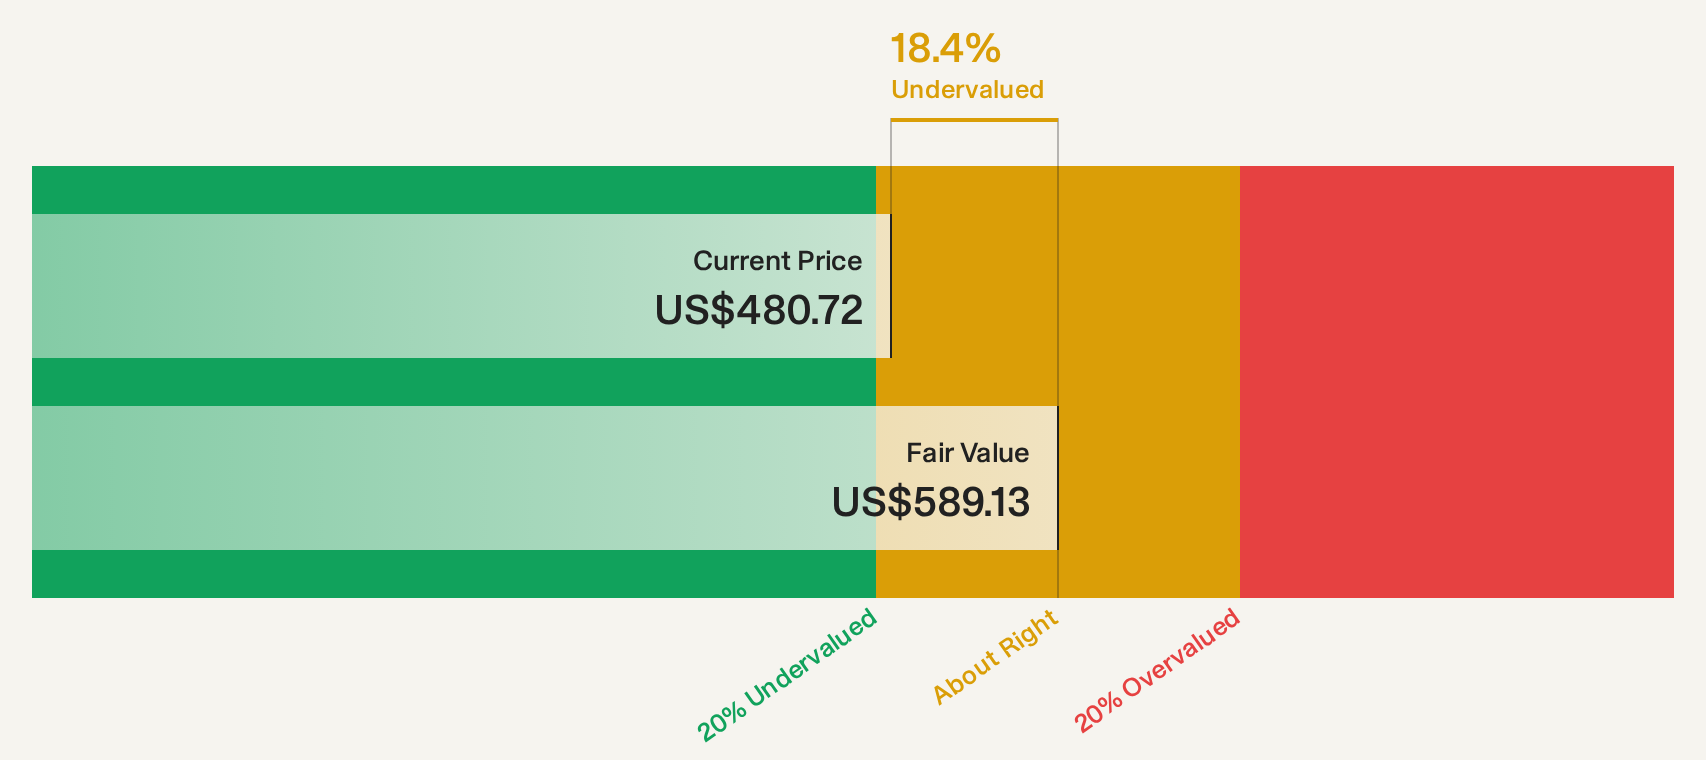
Estimated Discount To Fair Value: 17.2%
Northrop Grumman is trading at US$484.48, below its estimated future cash flow value of US$585.31, indicating potential undervaluation based on cash flows. While earnings growth is forecasted to lag behind the broader market, recent advancements such as the FORTITUDE™ chip and substantial defense contracts bolster its strategic position. Despite a high debt level, Northrop maintains a reliable 2.04% dividend yield and benefits from significant investments in microelectronics and missile technologies.
- Insights from our recent growth report point to a promising forecast for Northrop Grumman's business outlook.
- Get an in-depth perspective on Northrop Grumman's balance sheet by reading our health report here.
Summing It All Up
- Unlock our comprehensive list of 100 Undervalued US Stocks Based On Cash Flows by clicking here.
- Have a stake in these businesses? Integrate your holdings into Simply Wall St's portfolio for notifications and detailed stock reports.
- Join a community of smart investors by using Simply Wall St. It's free and delivers expert-level analysis on worldwide markets.
Interested In Other Possibilities?
- Explore high-performing small cap companies that haven't yet garnered significant analyst attention.
- Diversify your portfolio with solid dividend payers offering reliable income streams to weather potential market turbulence.
- Fuel your portfolio with companies showing strong growth potential, backed by optimistic outlooks both from analysts and management.
This article by Simply Wall St is general in nature. We provide commentary based on historical data and analyst forecasts only using an unbiased methodology and our articles are not intended to be financial advice. It does not constitute a recommendation to buy or sell any stock, and does not take account of your objectives, or your financial situation. We aim to bring you long-term focused analysis driven by fundamental data. Note that our analysis may not factor in the latest price-sensitive company announcements or qualitative material. Simply Wall St has no position in any stocks mentioned.
Have feedback on this article? Concerned about the content? Get in touch with us directly. Alternatively, email editorial-team@simplywallst.com