
Asian Market Value Picks: 3 Stocks Trading Below Estimated Worth
As the Asian markets navigate a landscape characterized by fluctuating economic indicators and evolving monetary policies, investors are increasingly on the lookout for stocks that may offer value amidst broader market uncertainties. In this context, identifying undervalued stocks becomes crucial, as these equities can potentially offer opportunities for growth by trading below their estimated worth in today's complex financial environment.
Top 10 Undervalued Stocks Based On Cash Flows In Asia
| Name | Current Price | Fair Value (Est) | Discount (Est) |
| Woori Financial Group (KOSE:A316140) | ₩32350.00 | ₩64525.41 | 49.9% |
| TOKAI (TSE:9729) | ¥2535.00 | ¥5037.09 | 49.7% |
| Shinhan Financial Group (KOSE:A055550) | ₩99500.00 | ₩195820.97 | 49.2% |
| Nissui (TSE:1332) | ¥1082.50 | ¥2151.90 | 49.7% |
| Mitsubishi Research Institute (TSE:3636) | ¥4840.00 | ¥9627.05 | 49.7% |
| Marco Polo Marine (SGX:5LY) | SGD0.118 | SGD0.23 | 49.4% |
| Kumagai GumiLtd (TSE:1861) | ¥1193.00 | ¥2362.31 | 49.5% |
| Innocean Worldwide (KOSE:A214320) | ₩17980.00 | ₩35599.11 | 49.5% |
| ENN Energy Holdings (SEHK:2688) | HK$49.14 | HK$96.85 | 49.3% |
| Double Medical Technology (SZSE:002901) | CN¥39.60 | CN¥79.04 | 49.9% |
Underneath we present a selection of stocks filtered out by our screen.
Mitsubishi Research Institute (TSE:3636)
Overview: Mitsubishi Research Institute, Inc. offers research, consulting, and ICT solutions to both public and private sectors in Japan with a market cap of ¥76.28 billion.
Operations: The company's revenue is primarily derived from IT services amounting to ¥76.61 billion and think tank consulting services totaling ¥53.15 billion.
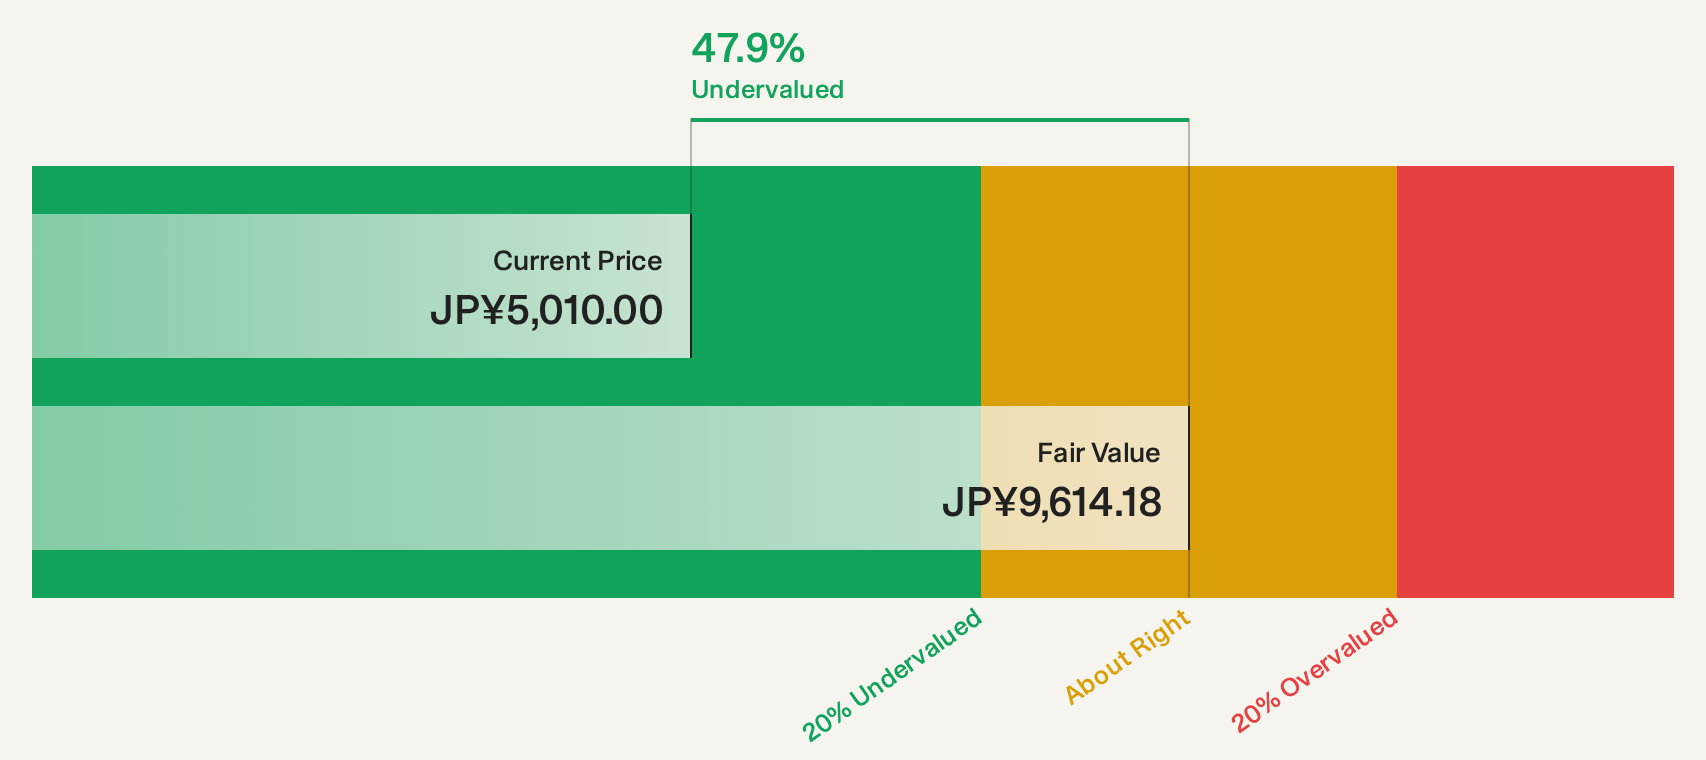
Estimated Discount To Fair Value: 49.7%
Mitsubishi Research Institute is trading at ¥4,840, significantly below its estimated future cash flow value of ¥9,627.05, suggesting it may be undervalued based on cash flows. Despite a recent 61.1% earnings growth and forecasts for net sales of ¥125 billion for the year ending September 2026, earnings are expected to decline by an average of 3.3% annually over the next three years. The dividend yield of 3.41% is not well covered by free cash flows.
- According our earnings growth report, there's an indication that Mitsubishi Research Institute might be ready to expand.
- Click here and access our complete balance sheet health report to understand the dynamics of Mitsubishi Research Institute.
Insource (TSE:6200)
Overview: Insource Co., Ltd. offers lecturer dispatch training, open lectures, and other educational services in Japan with a market cap of ¥54.63 billion.
Operations: The company generates revenue of ¥15.46 billion from its Education Service Business segment, which includes various training and educational services in Japan.
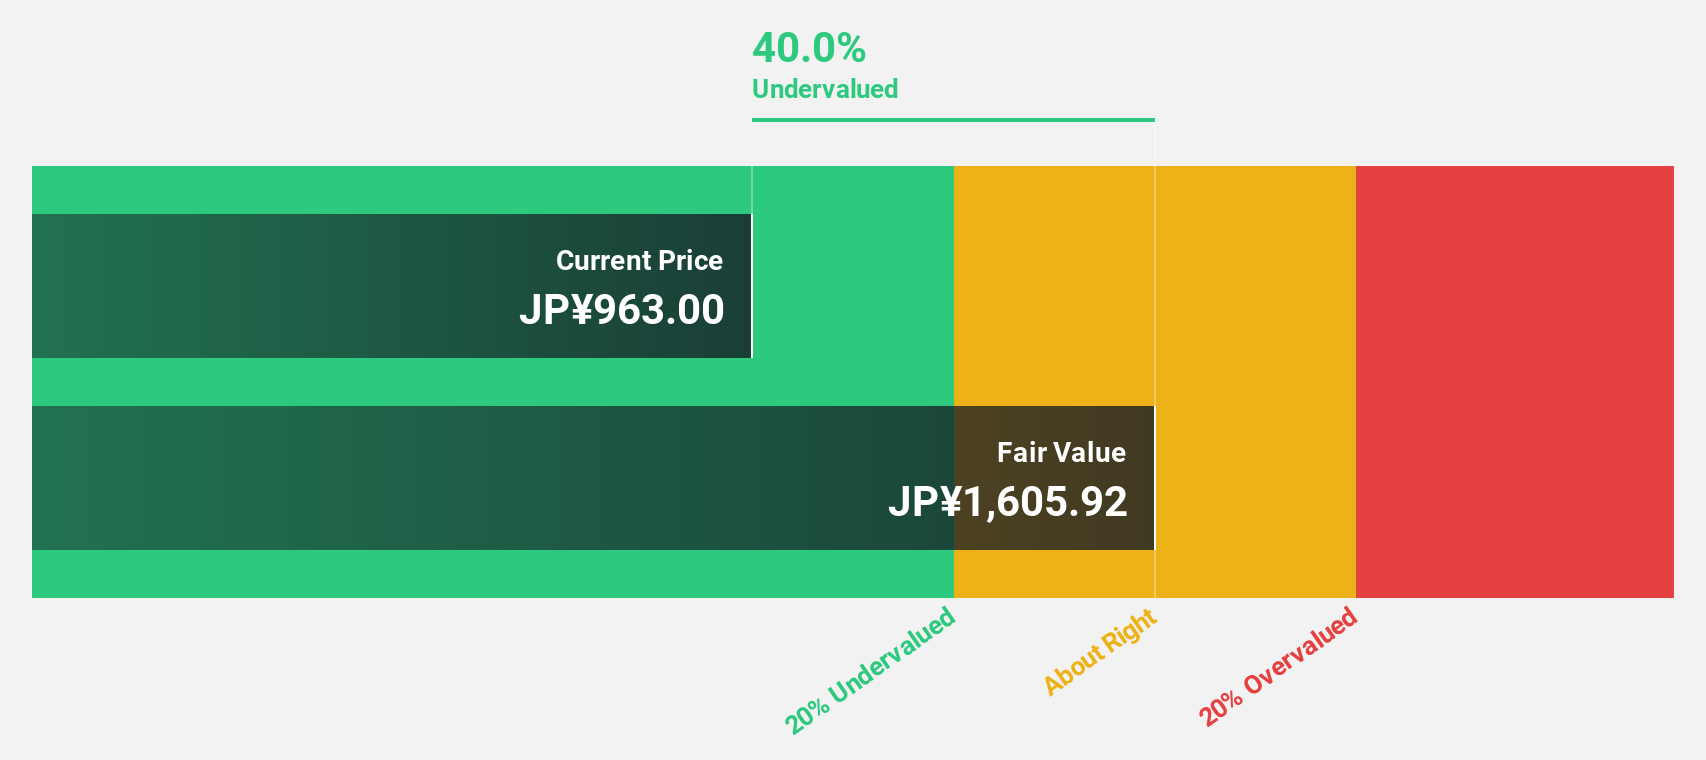
Estimated Discount To Fair Value: 40.8%
Insource Co., Ltd. is trading at ¥680, well below its estimated future cash flow value of ¥1,148.29, indicating potential undervaluation based on cash flows. Despite recent downward earnings revisions due to weaker-than-expected performance in key segments and slower order acquisition, the company maintains a high dividend yield of 4.34%. Its revenue growth forecast of 10.5% annually surpasses the Japanese market average, reflecting solid long-term prospects despite current challenges.
- Insights from our recent growth report point to a promising forecast for Insource's business outlook.
- Delve into the full analysis health report here for a deeper understanding of Insource.
Itoki (TSE:7972)
Overview: Itoki Corporation, with a market cap of ¥120.11 billion, is engaged in the planning, design, manufacturing, and sale of office furniture both in Japan and internationally through its subsidiaries.
Operations: The company's revenue segments include the Workplace Business, generating ¥115.70 billion, and the Equipment and Public Works-Related Business, contributing ¥43.91 billion.
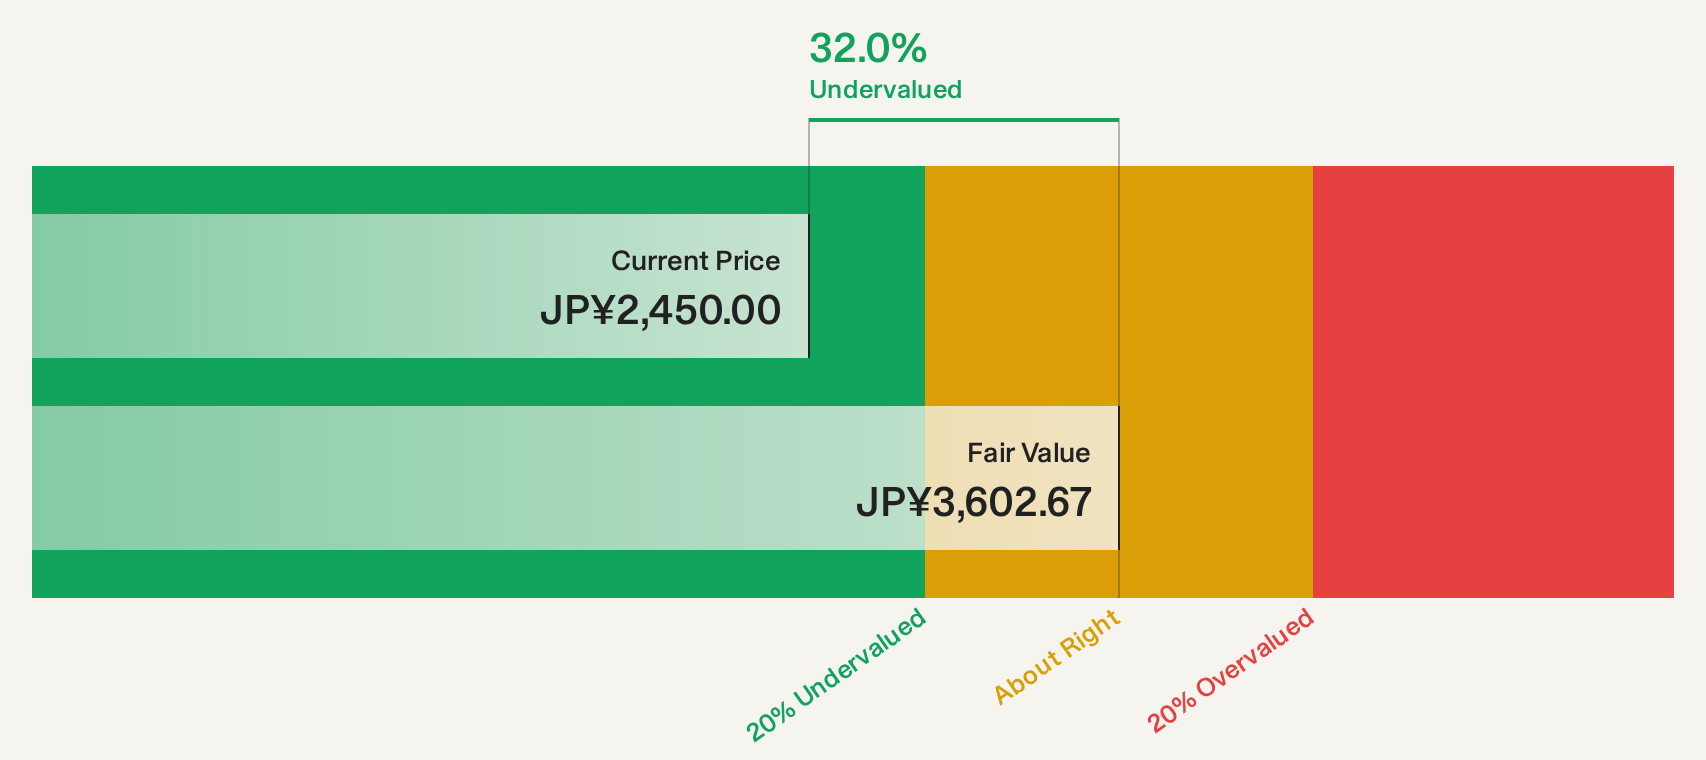
Estimated Discount To Fair Value: 32.7%
Itoki Corporation is trading at ¥2,428, significantly below its estimated future cash flow value of ¥3,609.19, highlighting potential undervaluation. Despite slower revenue growth forecasts of 6.4% annually compared to the Japanese market average of 6.9%, earnings are expected to grow faster at 10.2% annually versus the market's 9.5%. However, its dividend yield of 3.71% is not adequately supported by free cash flows, and return on equity remains modestly forecasted at 18.1%.
- Our earnings growth report unveils the potential for significant increases in Itoki's future results.
- Take a closer look at Itoki's balance sheet health here in our report.
Where To Now?
- Delve into our full catalog of 170 Undervalued Asian Stocks Based On Cash Flows here.
- Invested in any of these stocks? Simplify your portfolio management with Simply Wall St and stay ahead with our alerts for any critical updates on your stocks.
- Enhance your investing ability with the Simply Wall St app and enjoy free access to essential market intelligence spanning every continent.
Contemplating Other Strategies?
- Explore high-performing small cap companies that haven't yet garnered significant analyst attention.
- Diversify your portfolio with solid dividend payers offering reliable income streams to weather potential market turbulence.
- Fuel your portfolio with companies showing strong growth potential, backed by optimistic outlooks both from analysts and management.
This article by Simply Wall St is general in nature. We provide commentary based on historical data and analyst forecasts only using an unbiased methodology and our articles are not intended to be financial advice. It does not constitute a recommendation to buy or sell any stock, and does not take account of your objectives, or your financial situation. We aim to bring you long-term focused analysis driven by fundamental data. Note that our analysis may not factor in the latest price-sensitive company announcements or qualitative material. Simply Wall St has no position in any stocks mentioned.
Have feedback on this article? Concerned about the content? Get in touch with us directly. Alternatively, email editorial-team@simplywallst.com