
Fulton Financial (FULT) Launches CashFlow Central, Is The Stock Still A Bargain?
Fulton Financial (FULT) is in focus after subsidiary Fulton Bank rolled out CashFlow Central, a payments tool built with Fiserv that lets small businesses manage receivables and payables within existing digital banking channels.
The recent CashFlow Central launch lands at a time when Fulton Financial’s short term share price performance has cooled. The 30 day share price return is 5.72% and the 90 day share price return is 7.90% in the red, even though the year to date share price return sits at 14.38% and the 1 year total shareholder return is 25.88%. This builds on a three year total shareholder return of about 2x and a five year total shareholder return of 68.45%.
Compare Fulton Financial’s small business focus and income profile against a curated 8 dividend fortresses that are also aiming to reward shareholders through consistent cash payouts.
CashFlow Central targets small business clients, while Fulton Financial’s share price has cooled in recent months. Does that combination of digital investment and recent share price provide buyers with a favourable risk reward at today’s valuation?
Preferred P/E of 11x: Is it justified for Fulton Financial?
On recent figures, Fulton Financial trades on a P/E of 11x, which screens as good value both against peers and against what its own earnings profile might support.
The P/E multiple measures how much investors are paying for each dollar of earnings. For a regional bank like Fulton Financial, it is a quick way to compare how the market prices its profitability relative to other lenders with similar business models.
Here, the 11x P/E is described as attractive against several anchors. It is below the estimated fair P/E of 12.1x, below the US Banks industry average of 11.4x, and well under a peer group average of 24.3x. That combination points to a market that is valuing FULT more cautiously than those comparison points, even though earnings have grown 8.3% per year over the past 5 years and are forecast to keep rising at 8.48% per year.
The gap between the current share price of $22.27 and the SWS DCF estimate of future cash flow value at $45.39 reinforces this pattern. The stock is described as trading 50.9% below that cash flow value, and is flagged as good value on multiple checks including relative to peers and industry.
Explore the SWS fair ratio for Fulton Financial.
Result: Price-to-earnings of 11x (UNDERVALUED).
Still, Fulton Financial faces real swing factors, including pressure on US regional banks and the risk that new digital spending takes longer to pay off than hoped.
Find out about the key risks to this Fulton Financial narrative.
Another view on Fulton Financial’s value
The P/E story presents Fulton Financial as modestly priced, while the SWS DCF model suggests a higher valuation. With the share price at $22.27 and a future cash flow estimate of $45.39, the stock is described as 50.9% below that value. That gap raises a simple question: Is the market too cautious, or is the model too optimistic?
Look into how the SWS DCF model arrives at its fair value.
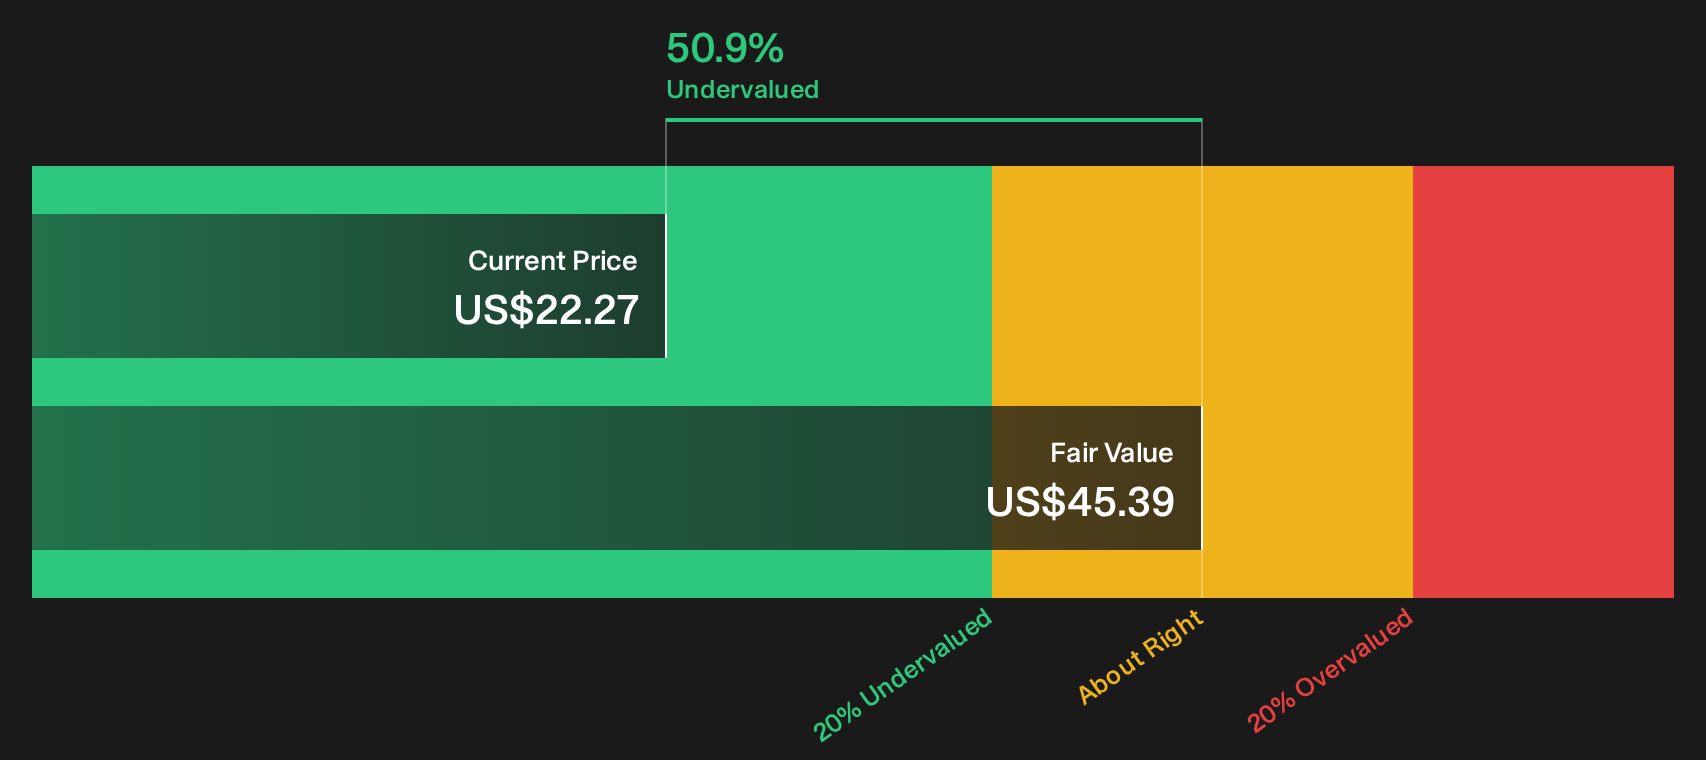
Simply Wall St performs a discounted cash flow (DCF) on every stock in the world every day (check out Fulton Financial for example). We show the entire calculation in full. You can track the result in your watchlist or portfolio and be alerted when this changes, or use our stock screener to discover 27 high quality undervalued stocks. If you save a screener we even alert you when new companies match - so you never miss a potential opportunity.
Next Steps
Comfortable with the mix of upside potential and flagged concerns so far, or still on the fence about Fulton Financial? Act quickly, review the data, and pressure test both sides of the story by weighing up the 5 key rewards and 1 important warning sign.
Looking for more investment ideas beyond Fulton Financial?
If Fulton Financial has sharpened your focus on valuation and risk, do not stop here. Broaden your watchlist and give yourself more options.
- Target potential bargains by scanning a curated set of companies that screen as attractively priced with solid fundamentals using the 27 high quality undervalued stocks.
- Prioritise resilience by reviewing a list of solid balance sheet and fundamentals (25 results) that aims to spotlight businesses built on stronger financial footing.
- Hunt for fresh opportunities by checking a focused group of 20 high quality undiscovered gems that may not yet be widely followed.
This article by Simply Wall St is general in nature. We provide commentary based on historical data and analyst forecasts only using an unbiased methodology and our articles are not intended to be financial advice. It does not constitute a recommendation to buy or sell any stock, and does not take account of your objectives, or your financial situation. We aim to bring you long-term focused analysis driven by fundamental data. Note that our analysis may not factor in the latest price-sensitive company announcements or qualitative material. Simply Wall St has no position in any stocks mentioned.
Have feedback on this article? Concerned about the content? Get in touch with us directly. Alternatively, email editorial-team@simplywallst.com