
Is San ju San Financial GroupInc (TSE:7322) Fully Valued Following Its Dividend And Profit Guidance Raise?
Dividend hike and upgraded profit outlook reshape the San ju San Financial Group Inc picture
San ju San Financial Group Inc (TSE:7322) has raised guidance on both dividends and earnings, giving investors fresh numbers to assess expected cash returns and profitability over the current fiscal period.
The group now projects a year-end dividend of ¥28 per share, compared with earlier guidance of ¥22. That points to an expected total annual payout of ¥50 per share for the year ending March 31, 2027, based on the new forecast.
Management also updated profit expectations. Forecast profit attributable to owners of parent for the same fiscal year is now ¥17.0b, compared with a prior projection of ¥15.0b, supported by higher anticipated net interest income at subsidiary San ju San Bank Ltd.
San ju San Financial GroupInc’s share price has slipped around 4% over the past week despite the upgraded dividend and profit guidance. However, the 90-day share price return of 19.51% and a very strong 1-year total shareholder return of 138.67% suggest momentum over the longer run remains firmly positive.
Spot other regional financials raising their payout game and earnings guidance by scanning our hand picked 32 dividend fortresses alongside San ju San Financial GroupInc.San ju San Financial Group Inc has already delivered a powerful rerating, and the richer dividend guidance and higher profit forecast keep the story moving. How much of that shift is already in the share price, and how much is still on the table?
Price-to-earnings of 18.6x for San ju San Financial Group Inc: Is it justified?
On current metrics, San ju San Financial Group Inc trades on a P/E of 18.6x, which places the share price at a richer level than both its peer group and the broader Japanese banks sector.
The P/E ratio compares the ¥2,150 share price to earnings per share and acts as a shorthand for how much investors pay for each unit of profit. For a lender like San ju San Financial Group Inc, this measure often reflects how investors weigh earnings quality, capital strength and the stability of interest income rather than just short term profit swings.
San ju San Financial Group Inc has produced 19.4% annual earnings growth over the past 5 years and 35.4% over the last year, alongside current net profit margins of 13.8%. That record can help explain why the market is willing to accept a P/E above both the JP Banks industry level and the broader peer average, even though return on equity of 5.2% is described as low and the allowance for bad loans is characterised as low at 33%.
The valuation gap versus peers is clear. The stock trades on a P/E of 18.6x compared with a 17.7x peer average and 16.1x for the JP Banks industry, which means investors are paying a visible premium for San ju San Financial Group Inc relative to other Japanese lenders.
See what the numbers say about this price — find out in our valuation breakdown.
Result: Price-to-earnings of 18.6x (OVERVALUED).
Still, San ju San Financial Group Inc faces clear risks if credit losses rise from current allowance levels or if earnings growth stalls while the P/E premium persists.
Find out about the key risks to this San ju San Financial GroupInc narrative.
Another view on San ju San Financial Group Inc’s valuation
The SWS DCF model presents a very different picture for San ju San Financial Group Inc. On that framework, the shares at ¥2,150 trade well above an estimated future cash flow value of ¥1,102.23, which points to an overvalued signal rather than a simple quality premium. Which lens do you trust more when cash flow and earnings send mixed messages?
Look into how the SWS DCF model arrives at its fair value.
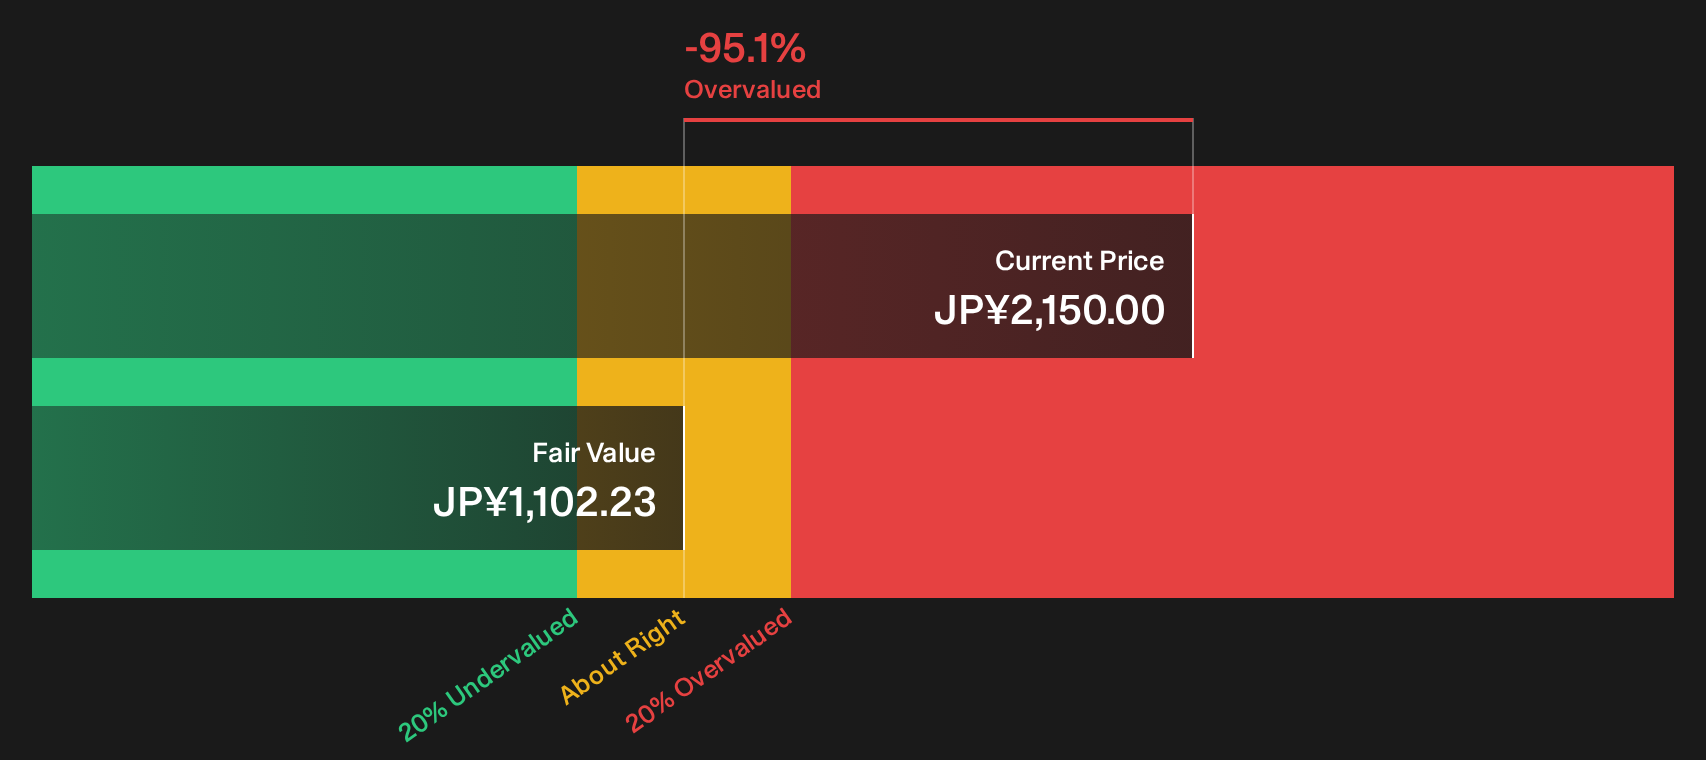
Simply Wall St performs a discounted cash flow (DCF) on every stock in the world every day (check out San ju San Financial GroupInc for example). We show the entire calculation in full. You can track the result in your watchlist or portfolio and be alerted when this changes, or use our stock screener to discover 14 high quality undervalued stocks. If you save a screener we even alert you when new companies match - so you never miss a potential opportunity.
Next Steps
Sentiment around San ju San Financial Group Inc is clearly mixed, with upgraded guidance on one side and valuation questions on the other. Move quickly, review the data, and weigh both the potential downside and upside using the 1 key reward and 2 important warning signs
Looking for more investment ideas beyond San ju San Financial Group Inc?
Do not stop at San ju San Financial Group Inc. Fresh opportunities often sit just outside the obvious, and missing them can quietly drag on long term returns.
- Target more resilient holdings by checking companies in the 22 resilient stocks with low risk scores that may carry lower overall risk scores.
- Hunt for stronger value by scanning the 14 high quality undervalued stocks where cash flow strength and pricing occasionally fall out of sync.
- Build a sturdier core by reviewing the list of solid balance sheet and fundamentals (23 results) and focusing on businesses with healthier financial foundations.
This article by Simply Wall St is general in nature. We provide commentary based on historical data and analyst forecasts only using an unbiased methodology and our articles are not intended to be financial advice. It does not constitute a recommendation to buy or sell any stock, and does not take account of your objectives, or your financial situation. We aim to bring you long-term focused analysis driven by fundamental data. Note that our analysis may not factor in the latest price-sensitive company announcements or qualitative material. Simply Wall St has no position in any stocks mentioned.
Have feedback on this article? Concerned about the content? Get in touch with us directly. Alternatively, email editorial-team@simplywallst.com