
Is Bank of America (BAC) A Bargain As New Bond Issuance Tests Its Valuation?
Bank of America (BAC) has just tapped bond investors again, issuing a series of senior unsecured notes with fixed coupons that range from 5.10% to 6.75% across 2028, 2032, 2038 and 2046 maturities.
Recent trading has been more cautious around Bank of America. The share price is down about 14.6% over the past month and 4.3% year to date, even though the 1 year total shareholder return is 9.7% and the 3 year total shareholder return is about 2.1x.
Spot 29 high quality undervalued stocks that, like Bank of America, pair large-scale balance sheets with fixed income activity and could be setting up for the next repricing phase.The bond moves and the recent 14.6% slide in Bank of America set up a simple fork in the road: Is most of the rerating already done, or does the current valuation still leave meaningful upside on the table?
Price-to-Earnings of 11.6x: Is it justified?
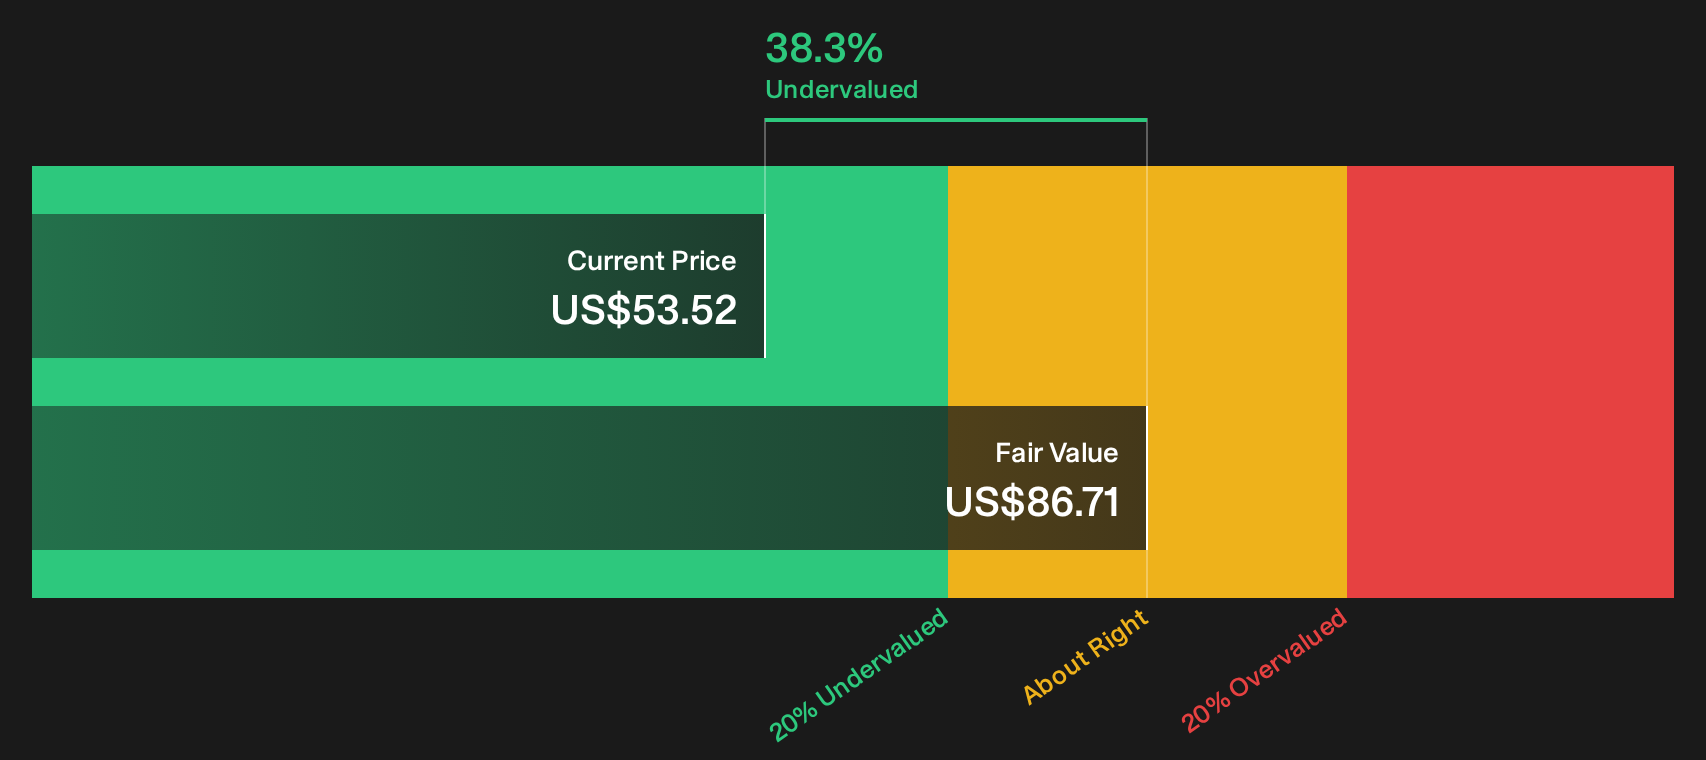
Bank of America looks inexpensive on headline numbers, trading at $53.52 against an internal fair value estimate of $86.71 and a P/E of 11.6x that screens as good value across several checks.
The P/E ratio compares the current share price to earnings per share and, for a large bank like Bank of America, it effectively tells you how much investors are willing to pay for each dollar of profit given its balance sheet, regulatory profile, and dividend stream.
At 11.6x earnings, the stock is described as trading 38.3% below one fair value estimate, with high quality earnings, 28.2% net profit margins, and forecast earnings growth of 5.77% per year. The same multiple is assessed as attractive versus an estimated fair P/E of 14.2x, which suggests a level the market could move toward if sentiment and forecasts hold.
Compared to peers, Bank of America is described as slightly expensive relative to the US Banks industry average P/E of 11.4x, yet still good value against a peer group average P/E of 12.5x. This points to a modest premium over the wider banking set but a discount versus its closer comparison group.
Explore the SWS fair ratio for Bank of America.
Result: Price-to-Earnings of 11.6x (UNDERVALUED).
Still, the recent share price slide, along with Bank of America’s reliance on global credit and trading cycles, could quickly challenge any simple undervaluation story.
Find out about the key risks to this Bank of America narrative.
Another View on Bank of America’s value
There is a second check running alongside the 11.6x P/E story. Bank of America is also described as trading 38.3% below an internal SWS DCF model estimate of future cash flow value at $86.71 per share, which points to a much larger valuation gap.
The DCF result relies on projected cash flows and discount rates rather than today’s earnings multiple, so it reflects a different risk profile that can be wrong in different ways. If both the low P/E and the DCF gap are accurate at the same time, the question becomes how patient an investor may need to be for that spread to close.
Look into how the SWS DCF model arrives at its fair value.
Simply Wall St performs a discounted cash flow (DCF) on every stock in the world every day (check out Bank of America for example). We show the entire calculation in full. You can track the result in your watchlist or portfolio and be alerted when this changes, or use our stock screener to discover 29 high quality undervalued stocks. If you save a screener we even alert you when new companies match - so you never miss a potential opportunity.
Next Steps
Sentiment around Bank of America is clearly mixed right now, so treat this as your cue to review the numbers yourself and pressure test the thesis against your own risk tolerance and time horizon. To see what optimistic investors are focusing on, take a look at the 5 key rewards.
Looking for more Bank of America style investment ideas?
If Bank of America has you rethinking what value looks like, use this moment to broaden your watchlist with a few targeted, data driven filters.
- Target resilient upside by scanning for quality companies trading below internal estimates with the 29 high quality undervalued stocks.
- Lock in reliable cash flow potential by reviewing stocks that meet strict payout and yield checks inside the 8 dividend fortresses.
- Dial down volatility risk by filtering for financially robust businesses using the 31 resilient stocks with low risk scores.
This article by Simply Wall St is general in nature. We provide commentary based on historical data and analyst forecasts only using an unbiased methodology and our articles are not intended to be financial advice. It does not constitute a recommendation to buy or sell any stock, and does not take account of your objectives, or your financial situation. We aim to bring you long-term focused analysis driven by fundamental data. Note that our analysis may not factor in the latest price-sensitive company announcements or qualitative material. Simply Wall St has no position in any stocks mentioned.
Have feedback on this article? Concerned about the content? Get in touch with us directly. Alternatively, email editorial-team@simplywallst.com