
Sumitomo Realty & Development (TSE:8830) Tests Its Cross Border Story On Valuation
Sumitomo Realty & Development (TSE:8830) steps into the spotlight as Managing Executive Officer Toshiyuki Masui presents at the 3rd Nikkei India Japan Economy and Investment Forum in Mumbai, putting its cross border real estate ambitions in focus.
Recent trading tells a mixed story for Sumitomo Realty & Development. The share price is down 3.3% over the past week and has declined 21.21% year to date, while the 3 year total shareholder return of 66.82% and 5 year total shareholder return of 60.29% point to stronger longer term momentum that recent weakness has pulled back from.
Scan Sumitomo Realty & Development alongside other cross border real estate plays by reviewing the hand picked list of solid balance sheet and fundamentals (23 results) positioned for international expansion themes.
Bulls point to rising revenue and earnings, while bears point to a falling share price and a low value score. Which story does Sumitomo Realty & Development’s current valuation actually support?
Price-to-Earnings of 12.7x: Is it justified?
Valuation looks split for Sumitomo Realty & Development. The shares last closed at ¥3,075, while the stock trades on a P/E of 12.7x that can appear inexpensive against some yardsticks and expensive against others.
The P/E ratio compares the ¥3,075 share price to the company’s earnings per share. For a property developer and landlord, this metric often reflects what investors are willing to pay today for each unit of current profit, given factors like revenue growth of 4.1% a year and earnings growth of 4.5% a year that are forecast in the Statements Data.
Against the wider JP market, a P/E of 12.7x sits below the 13.9x average, which points to a lower earnings multiple than many domestic stocks. That discount contrasts sharply with the JP Real Estate industry, where the average P/E is 9.6x and Sumitomo Realty & Development screens as more expensive, and also with the 12.2x peer average where the shares again come out richer. Set against an estimated fair P/E of 16.2x, the current multiple is materially lower, which highlights a gap relative to that fair value estimate.
Explore the SWS fair ratio for Sumitomo Realty & Development.
Result: Price-to-Earnings of 12.7x (ABOUT RIGHT)
Still, the recent 21.21% year to date share price decline and a low value score of 1 suggest that sentiment could turn sharply if expectations slip.
Find out about the key risks to this Sumitomo Realty & Development narrative.
Another view on Sumitomo Realty & Development’s value
The SWS DCF model presents a very different perspective. With an estimated future cash flow value of ¥968.33 per share compared with the current ¥3,075 price, Sumitomo Realty & Development appears heavily overvalued. That gap raises a simple question for investors: Which story do you place more weight on, earnings multiples or cash flows?
Look into how the SWS DCF model arrives at its fair value.
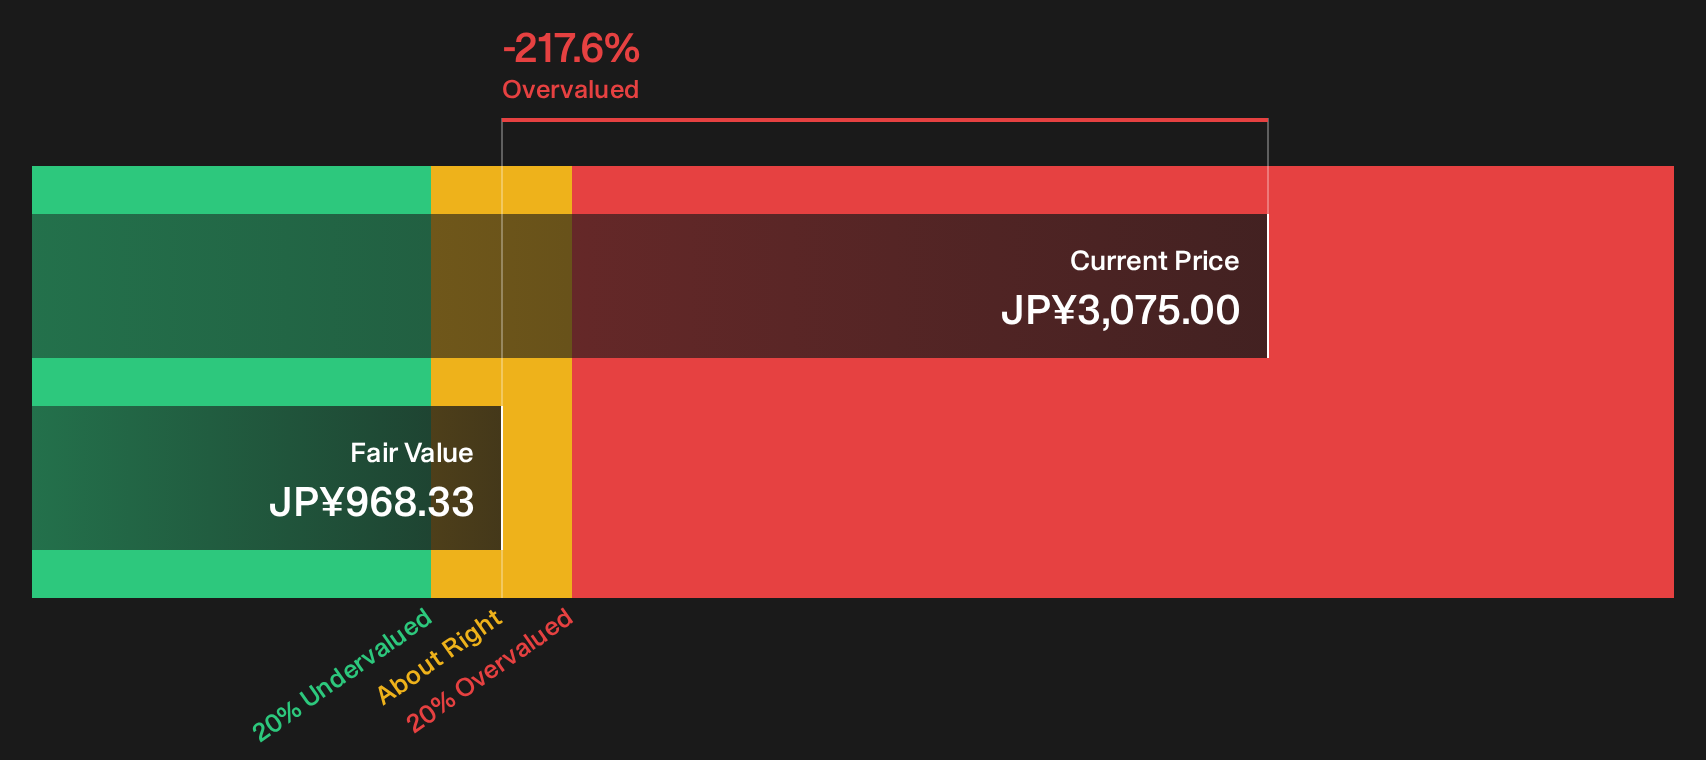
Simply Wall St performs a discounted cash flow (DCF) on every stock in the world every day (check out Sumitomo Realty & Development for example). We show the entire calculation in full. You can track the result in your watchlist or portfolio and be alerted when this changes, or use our stock screener to discover 14 high quality undervalued stocks. If you save a screener we even alert you when new companies match - so you never miss a potential opportunity.
Next Steps
Mixed signals run through this Sumitomo Realty & Development story, so do not leave the verdict entirely to models or headlines. Act while the data is fresh and weigh the company's risks against its potential rewards by reviewing the 3 key rewards and 1 important warning sign
Looking for more investment ideas beyond Sumitomo Realty & Development?
If Sumitomo Realty & Development has sharpened your focus on valuation and risk, you can take that momentum into your next move with a curated set of ideas.
- Target potential mispricing by reviewing the 14 high quality undervalued stocks that combine strong fundamentals with prices that may not fully reflect their financial profile.
- Strengthen your income playbook by scanning the 32 dividend fortresses designed for investors who want yield with supporting balance sheets and cash flows.
- Dial down volatility in your portfolio by focusing on the 22 resilient stocks with low risk scores built around resilient businesses that score well on risk metrics.
This article by Simply Wall St is general in nature. We provide commentary based on historical data and analyst forecasts only using an unbiased methodology and our articles are not intended to be financial advice. It does not constitute a recommendation to buy or sell any stock, and does not take account of your objectives, or your financial situation. We aim to bring you long-term focused analysis driven by fundamental data. Note that our analysis may not factor in the latest price-sensitive company announcements or qualitative material. Simply Wall St has no position in any stocks mentioned.
Have feedback on this article? Concerned about the content? Get in touch with us directly. Alternatively, email editorial-team@simplywallst.com