
Seibu Holdings (TSE:9024) Following Its Slide, Is The Valuation Now A Buying Opportunity?
Seibu Holdings (TSE:9024) is back in focus after a recent share price move that left the stock down about 18% year to date, despite positive annual revenue and net income growth.
Recent trading tells a mixed story. The share price is roughly flat over the past quarter, yet the year to date share price return is down about 18%. The 1 year total shareholder return has declined about 36%, even after a very large 5 year total shareholder return of just over 200% for Seibu Holdings.
Spot potential rebound stories alongside Seibu Holdings by scanning a curated set of under-pressure but financially solid companies through the 14 high quality undervalued stocks.For Seibu Holdings, that slide sits awkwardly alongside rising annual revenue and net income. Is the valuation now reflecting a weaker business, or has sentiment simply swung too far and created a mispriced setup?
Preferred P/E of 21.6x: Is it justified for Seibu Holdings?
On the numbers provided, Seibu Holdings trades on a P/E of 21.6x, which sits well above several reference points and suggests investors are already paying a premium for its earnings at the current ¥3,584 share price.
The P/E ratio compares the current share price with earnings per share and gives a quick sense of how much investors are willing to pay for each unit of profit. For a group like Seibu Holdings, with exposure to transport, hotels, and real estate, that means the market is putting a relatively rich tag on earnings that are tied to cyclical end markets and capital intensive operations.
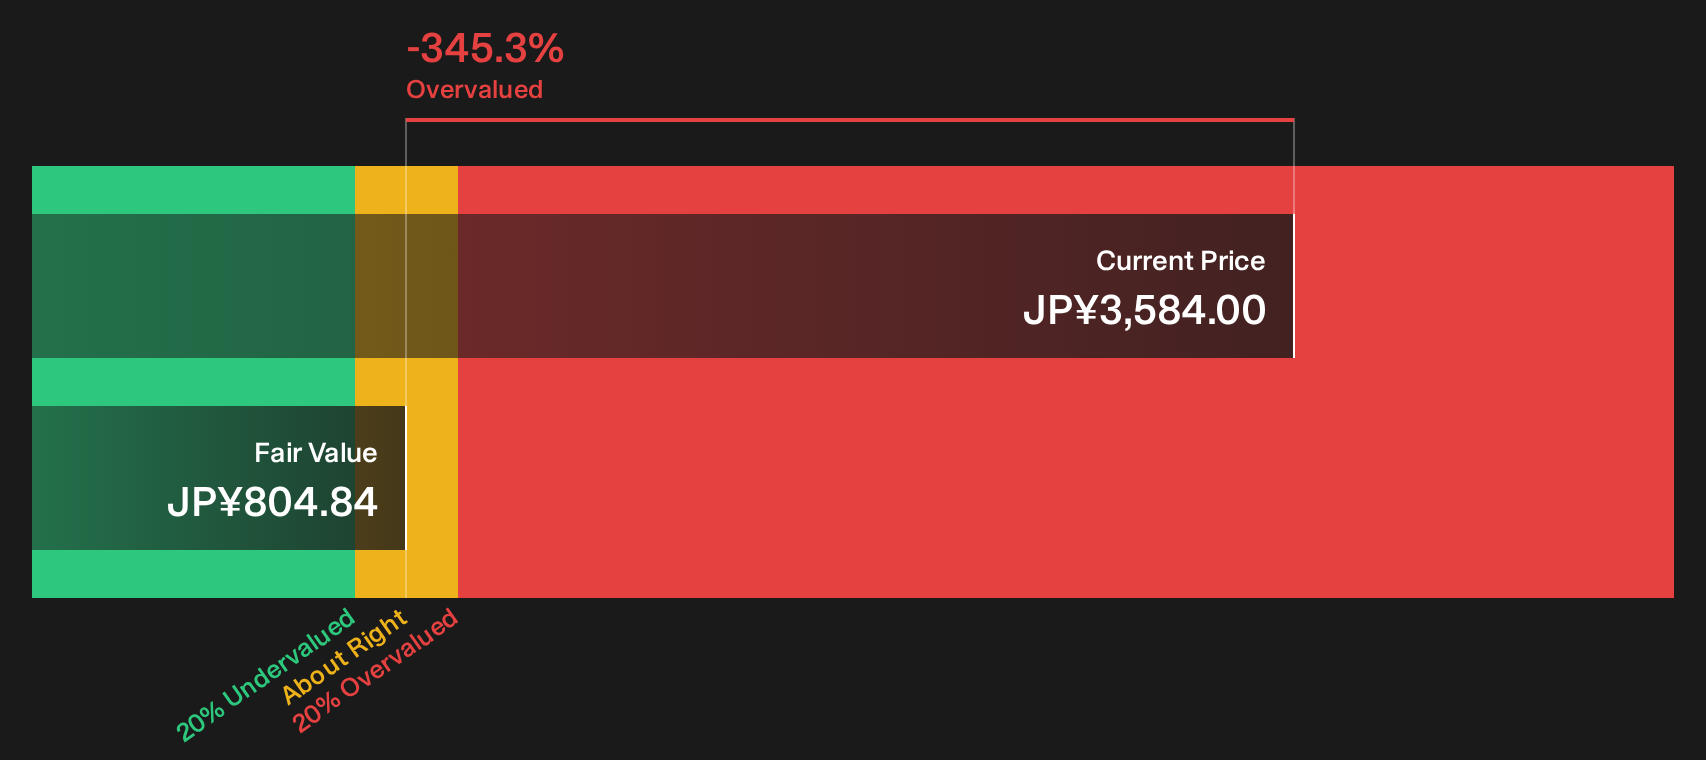
That premium is not small. The stock trades on 21.6x earnings compared with a peer average of 12.5x and a broader JP Transportation industry average of 11.7x, which is a material gap. Compared with the estimated fair P/E of 16.4x, the current multiple also sits well above a level the market could move towards if expectations cool. Overlay the SWS DCF model output, which estimates future cash flow value at ¥804.84 per share, and you have a discounted cash flow signal that points to a share price meaningfully above that central valuation anchor right now.
Explore the SWS fair ratio for Seibu Holdings.
Result: Price-to-earnings of 21.6x (OVERVALUED)
Still, Seibu Holdings faces clear risks if tourism demand softens again or if higher funding costs pressure returns from its capital intensive transport and property assets.
Find out about the key risks to this Seibu Holdings narrative.
Another View On Seibu Holdings: What Does The SWS DCF Model Say?
The earnings multiple paints Seibu Holdings as expensive, but the SWS DCF model goes even further. With the share price at ¥3,584 and projected future cash flow value at ¥804.84 per share, this framework points to a stock that looks heavily overvalued. Which lens do you trust more when cash flow and headline earnings disagree this much?
Look into how the SWS DCF model arrives at its fair value.
Simply Wall St performs a discounted cash flow (DCF) on every stock in the world every day (check out Seibu Holdings for example). We show the entire calculation in full. You can track the result in your watchlist or portfolio and be alerted when this changes, or use our stock screener to discover 14 high quality undervalued stocks. If you save a screener we even alert you when new companies match - so you never miss a potential opportunity.
Next Steps
Does this setup feel too stretched or just misunderstood for Seibu Holdings right now? Move fast, review the underlying figures, then weigh both sides of the story by checking the 1 key reward and 2 important warning signs
Looking for more ideas beyond Seibu Holdings?
If Seibu Holdings has you questioning where the best risk and reward trade offs sit, do not stop here. Broader opportunity often shows up where pressure and quality intersect.
- Target potential mispricings by scanning a focused set of quality stocks that look out of favour through the 14 high quality undervalued stocks.
- Strengthen your downside protection by zeroing in on businesses with cleaner finances and sturdier balance sheets using the list of solid balance sheet and fundamentals (23 results).
- Hunt for overlooked potential by tracking a curated pool of quieter opportunities with solid fundamentals through the 75 high quality undiscovered gems.
This article by Simply Wall St is general in nature. We provide commentary based on historical data and analyst forecasts only using an unbiased methodology and our articles are not intended to be financial advice. It does not constitute a recommendation to buy or sell any stock, and does not take account of your objectives, or your financial situation. We aim to bring you long-term focused analysis driven by fundamental data. Note that our analysis may not factor in the latest price-sensitive company announcements or qualitative material. Simply Wall St has no position in any stocks mentioned.
Have feedback on this article? Concerned about the content? Get in touch with us directly. Alternatively, email editorial-team@simplywallst.com