
Will Raised 2026 Guidance Change ITT (ITT) Stock Narrative
- ITT reported strong Q2 2026 results, with 51% revenue growth, 13% organic expansion, wider operating margins, and raised full-year guidance, including an adjusted EPS outlook of $8.22.
- Order momentum in the Connect & Control Technologies segment, especially from defense customers across multiple regions, highlights how ITT’s acquisitions and product breadth are contributing to a larger, more visible backlog.
- We will now look at how ITT’s stronger margins and upgraded 2026 guidance could influence the longer-term investment narrative.
See how ITT’s momentum compares with other industrial names by reviewing our curated list of 43 power grid technology and infrastructure stocks.
ITT Investment Narrative Recap
For ITT, the big picture hinges on belief in a broader, more diversified industrial platform that can turn its larger backlog and segment mix into steadier earnings over time. The strong Q2 2026 print and raised guidance support that story, but the near term share driver still looks like execution on margin expansion rather than headline revenue growth.
The key risk right now sits in project timing and integration. A heavier tilt toward multi year flow and marine projects can create lumpiness if customers delay orders, while recent deals like SPX FLOW and Svanehøj still need clean integration. The latest results support confidence, but they do not remove that uncertainty.
The most relevant recent development is ITT’s acquisition of SPX FLOW and related flow assets, which sit behind a significant portion of the backlog and Q2 growth. These businesses expand exposure to nutrition, marine and process industries and tie into the guidance for 5% to 8% organic growth and an adjusted EPS outlook of $8.22 in 2026.
For investors, the potential catalyst is straightforward. Progress on SPX FLOW cost synergies, better utilization across the combined Flow Technologies platform, and evidence that these long cycle contracts convert into 10% to 11% free cash flow margins would support the higher margin narrative. Execution missteps or slower cash conversion would more clearly highlight the integration and debt coverage risks raised by past analysis.
How Current ITT Forecasts Stack Up
ITT's narrative projects US$6.5b revenue and US$802.9m earnings by 2029. This implies 11.3% yearly revenue growth and roughly a 90% earnings increase from US$421.6m today.
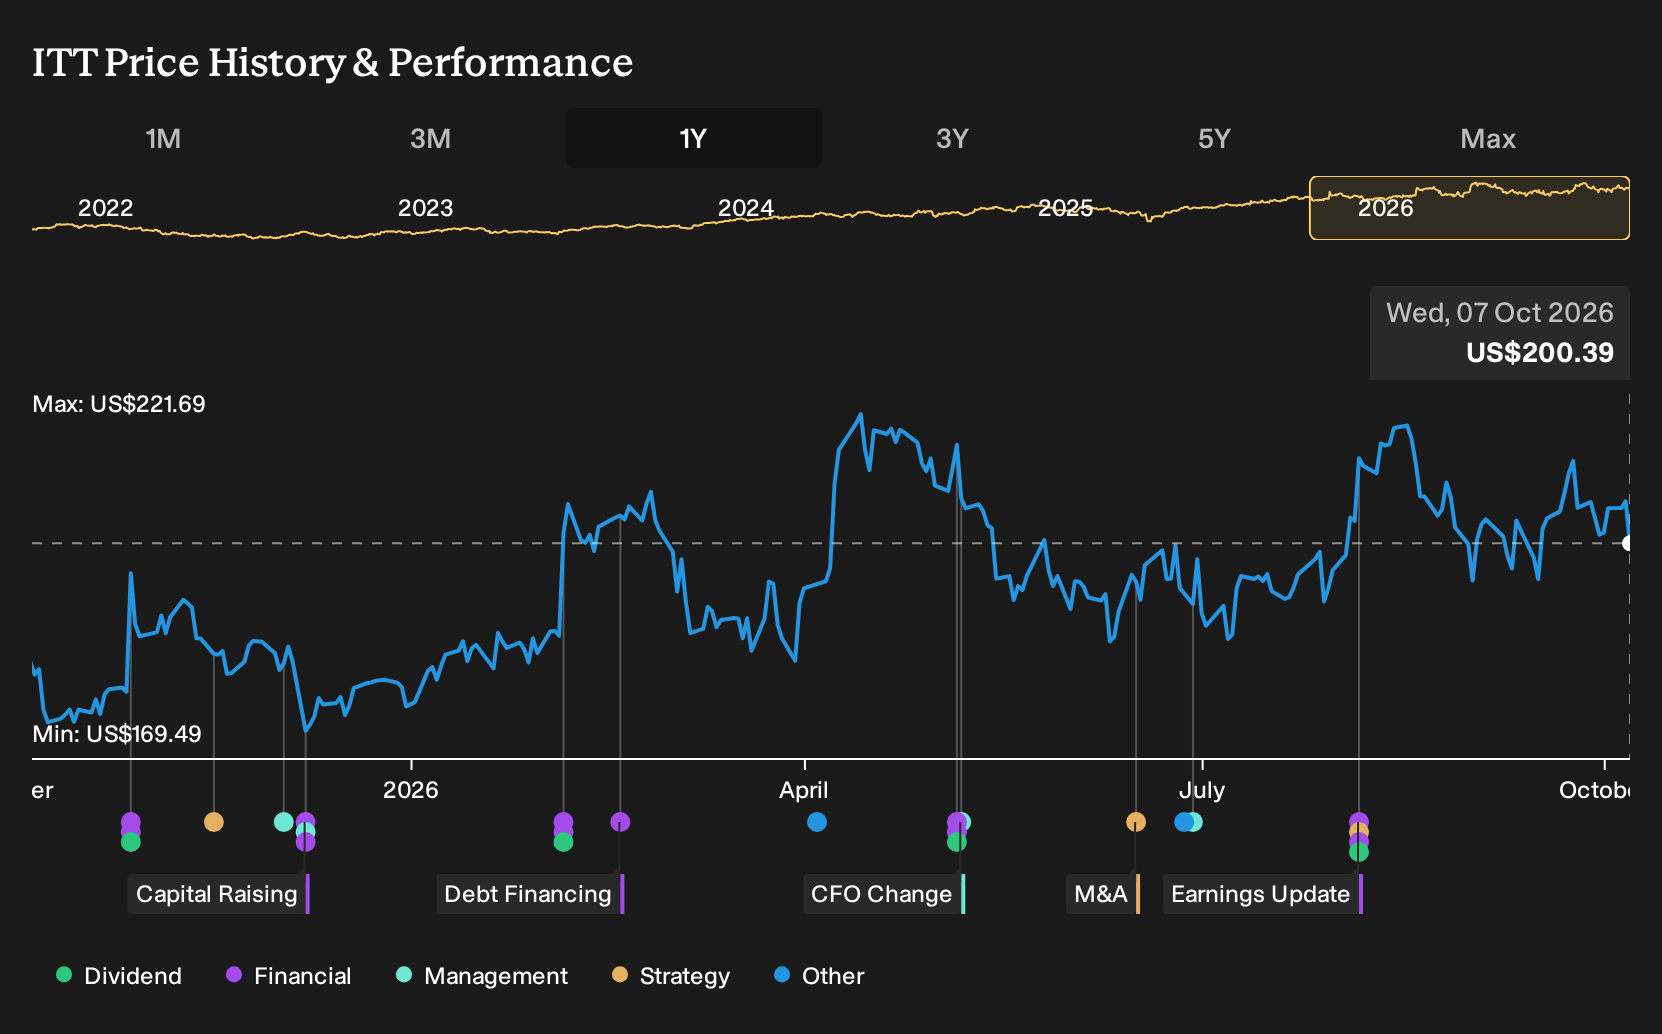
Discover how ITT's fair value indicates a 29% potential upside to its current price, a discount that could close sooner than many investors anticipate.
Exploring Other Perspectives
For ITT, the lowest analysts focus less on the strong Q2 print and more on concentration risk in long cycle pump projects. Before this news, they were penciling in about US$6.6b of revenue and US$862.6m of earnings by 2029. That is actually higher than consensus, yet paired with a lower US$204.53 target, which shows how sharply opinions can diverge. Use this Q2 update as your cue to compare those pre news assumptions with your own view on project timing, energy transition spending and the level of risk you are comfortable taking.
Explore another ITT fair value estimate, including one that suggests it could be worth just $240.47.
Form Your Own Verdict
Don't just follow the ticker. Dig into the data and build a conviction that's truly your own.
- A great starting point for your ITT research is our analysis highlighting 3 key rewards and 2 important warning signs that could impact your investment decision.
- See our latest analysis for ITT. The report includes a comprehensive fundamental analysis summarized in a single visual, the Snowflake, making it easy to evaluate ITT's overall financial health at a glance.
Looking For More Investment Ideas Beyond ITT?
If ITT has sharpened your focus on quality industrial opportunities, use this as a springboard to scan a broader field of candidates through the Simply Wall St Screener.
- For investors who want potential mispricing backed by fundamentals, start with our 29 high quality undervalued stocks that line up solid cash flows with balance sheet strength.
- If portfolio resilience matters most to you, narrow your search to a 31 resilient stocks with low risk scores based on a combination of financial health and lower risk scores.
- When you are hunting for fresher stories that are not widely followed, scan our 20 high quality undiscovered gems and see which businesses match your criteria.
This article by Simply Wall St is general in nature. We provide commentary based on historical data and analyst forecasts only using an unbiased methodology and our articles are not intended to be financial advice. It does not constitute a recommendation to buy or sell any stock, and does not take account of your objectives, or your financial situation. We aim to bring you long-term focused analysis driven by fundamental data. Note that our analysis may not factor in the latest price-sensitive company announcements or qualitative material. Simply Wall St has no position in any stocks mentioned.
Have feedback on this article? Concerned about the content? Get in touch with us directly. Alternatively, email editorial-team@simplywallst.com