
Bancorp (TBBK) Could Be 64% Undervalued On Finetics Launch
Bancorp (TBBK) has just rolled out Finetics, a new embedded finance platform that lets nonbank companies plug checking, payments, and card services directly into their own digital products and customer experiences.
Against that product launch backdrop, Bancorp’s share price has retreated sharply in recent months, with a 30 day share price return down 28.02% and a year to date decline of 28.86%, even though long term total shareholder returns over three and five years remain firmly positive.
Scan beyond Bancorp and see how other embedded finance players are priced today with a curated list of 35 profitable AI stocks that aren't just burning cash that are riding similar digital banking themes.
Bancorp now trades well below both its recent high and the average analyst target. Where does a reasonable fair value range actually line up between the price and those estimates?
Price-to-Earnings of 8.5x: Is it justified?
Bancorp trades on a P/E of 8.5x against a last close of $48.13, while peers and fair value benchmarks both sit materially higher. This points to a market that prices its earnings more cautiously than the reference points suggest.
The P/E ratio compares the current share price to earnings per share, so it shows how many dollars investors pay for each dollar of profit. For a bank tied closely to embedded finance, this simple multiple becomes a shorthand for how much confidence the market has in the durability and quality of those earnings streams.
On the data provided, the stock is flagged as good value on several fronts. The P/E of 8.5x screens as cheaper than the peer group average of 13.1x and below the wider US Banks industry at 11.5x. The same earnings are also described as high quality, which suggests the discount is not being driven purely by profit quality concerns. Against an estimated fair P/E of 14.5x, the gap is even wider. This indicates a level the market could move toward if sentiment and fundamentals stayed aligned with that assessment.
That relative picture is important context while Bancorp shares are down over the past year and have underperformed both the US market and the US Banks industry. A P/E well below industry and fair ratio markers signals that investors currently pay less for each dollar of Bancorp earnings than for many banking peers, even though analysts collectively model earnings growth of 19% per year that is described as faster than the broader US market.
Explore the SWS fair ratio for Bancorp.
Result: Price-to-Earnings of 8.5x (UNDERVALUED).
Still, the sharp 1 year share price decline and a 23.1% fall in annual revenue growth highlight that Bancorp’s earnings multiple could stay compressed if confidence weakens further.
Find out about the key risks to this Bancorp narrative.
Another view on Bancorp’s value
The SWS DCF model presents a much stronger picture, with Bancorp trading at $48.13 compared with an estimated future cash flow value of $135.13. That gap suggests a very wide undervaluation on this measure. It raises a key question: Is the market right, or is the model too generous?
Look into how the SWS DCF model arrives at its fair value.
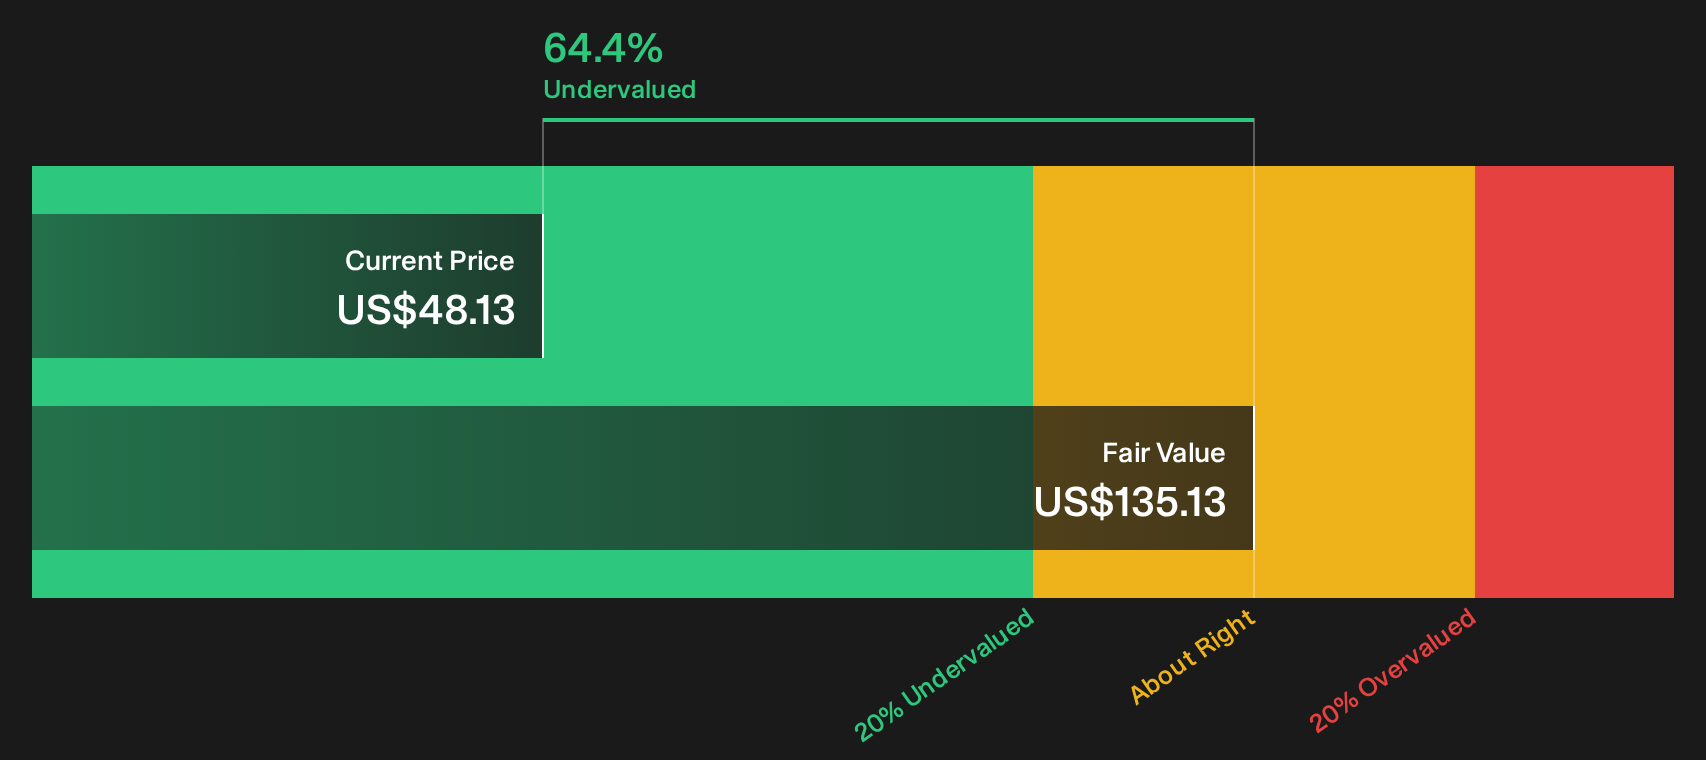
Simply Wall St performs a discounted cash flow (DCF) on every stock in the world every day (check out Bancorp for example). We show the entire calculation in full. You can track the result in your watchlist or portfolio and be alerted when this changes, or use our stock screener to discover 29 high quality undervalued stocks. If you save a screener we even alert you when new companies match - so you never miss a potential opportunity.
Next Steps
Mixed on Bancorp after all that detail. If you want a clear view before the market moves again, weigh those concerns and bright spots against the 5 key rewards and 2 important warning signs.
Looking for more Bancorp sized investment ideas?
Do not stop at Bancorp. Use the Simply Wall St Screener to quickly spot other potential opportunities that match the kind of edge you want in your portfolio.
- Target income resilience by reviewing a curated group of 8 dividend fortresses that aim to keep cash flowing into your account.
- Hunt for potential bargains by scanning a focused set of 29 high quality undervalued stocks that combine quality fundamentals with market pessimism.
- Prioritize capital preservation by filtering for 31 resilient stocks with low risk scores that score well on balance sheet strength and risk metrics.
This article by Simply Wall St is general in nature. We provide commentary based on historical data and analyst forecasts only using an unbiased methodology and our articles are not intended to be financial advice. It does not constitute a recommendation to buy or sell any stock, and does not take account of your objectives, or your financial situation. We aim to bring you long-term focused analysis driven by fundamental data. Note that our analysis may not factor in the latest price-sensitive company announcements or qualitative material. Simply Wall St has no position in any stocks mentioned.
Have feedback on this article? Concerned about the content? Get in touch with us directly. Alternatively, email editorial-team@simplywallst.com