
HASEKO (TSE:1808), What Is Drawing Fresh Attention Now?
HASEKO (TSE:1808) drew investor attention after recent share performance data showed the stock down about 9% over the past month and roughly 7% over the past 3 months, with a last close of ¥2,573.
Looking beyond the recent pullback, HASEKO’s share price has declined 17.11% year to date, even though total shareholder return sits at 6.63% over one year and more than doubles over three and five years. This points to fading near term momentum against a stronger longer term record.
Compare HASEKO’s recent pullback with other potential rebound candidates by scanning our hand picked list of 15 high quality undervalued stocks that combine solid fundamentals with compressed valuations.
The recent slide leaves HASEKO looking cheaper on the surface while long term holders still show gains. Does that reset tilt the risk reward toward fresh buyers, or keep caution in charge as valuation gets unpacked next?
Price-to-Earnings of 10.7x: Is it justified for HASEKO?
On a simple earnings yardstick, HASEKO trades on a P/E of 10.7x, which leaves the stock looking cheaper than the broader JP market but richer than several close peers.
The P/E ratio compares the share price with net profit per share and effectively tells you how many years of current earnings investors are willing to pay for. For a construction and real estate focused group like HASEKO, this matters because profit levels can be cyclical and investors often demand a margin of safety when earnings visibility is limited.
HASEKO’s current multiple of 10.7x sits below the JP market average P/E of 14x, which suggests the market is not paying a premium for its earnings. At the same time, this valuation looks demanding compared with both the JP Consumer Durables industry average of 10x and a peer group sitting near 8.2x, so the stock carries a higher price tag than many similar businesses. Against that backdrop, the estimated fair P/E of 15.9x is materially higher than the current 10.7x. This indicates that, if the market were to align with that fair ratio, there could be meaningful room for the multiple to adjust upward.
Explore the SWS fair ratio for HASEKO.
Result: Price-to-Earnings of 10.7x (ABOUT RIGHT)
Still, HASEKO’s heavy exposure to condominium construction and its relatively higher P/E than close peers could quickly weigh on sentiment if project volumes or pricing soften.
Find out about the key risks to this HASEKO narrative.
Another View on HASEKO’s Valuation
The P/E discussion tells one story, but the SWS DCF model points in the opposite direction for HASEKO. On that measure, the shares trade around ¥2,573 compared with an estimated future cash flow value of about ¥2,443, which frames the stock as overvalued rather than discounted. That split raises a simple question for you as an investor: Which lens do you trust more, current earnings or long range cash flow assumptions?
Look into how the SWS DCF model arrives at its fair value.
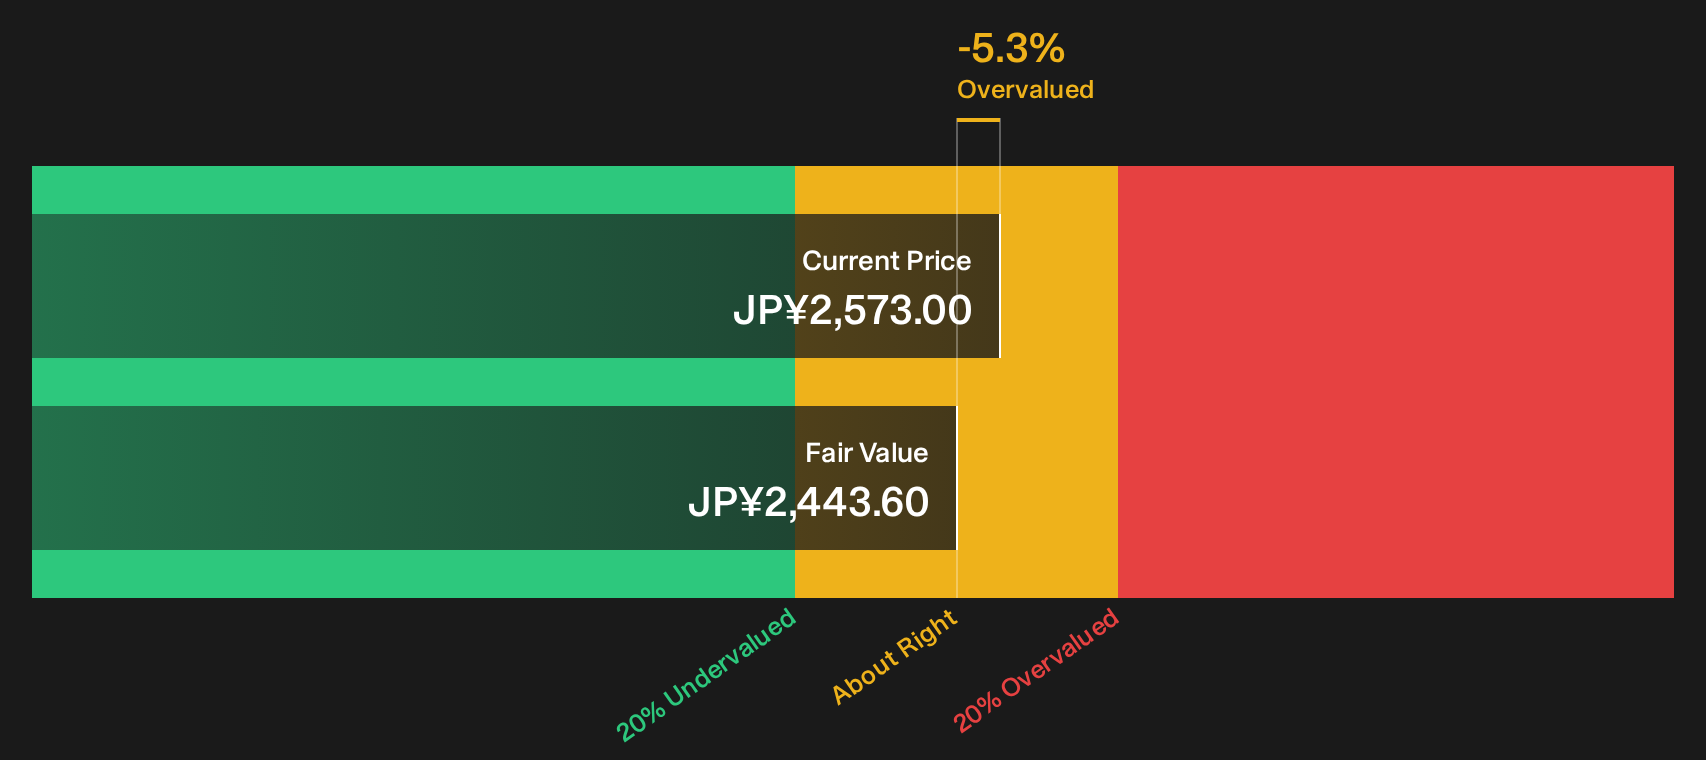
Simply Wall St performs a discounted cash flow (DCF) on every stock in the world every day (check out HASEKO for example). We show the entire calculation in full. You can track the result in your watchlist or portfolio and be alerted when this changes, or use our stock screener to discover 15 high quality undervalued stocks. If you save a screener we even alert you when new companies match - so you never miss a potential opportunity.
Next Steps
Mixed signals on HASEKO’s price and valuation can easily blur the picture, so consider your options while sentiment is still unsettled and stress test the story yourself with the 4 key rewards and 1 important warning sign.
Looking for more HASEKO sized investment ideas?
If HASEKO has you thinking hard about price and quality, use this moment to widen your watchlist with a few focused screeners built for different angles.
- Target resilient compounding potential by reviewing companies offering dependable income profiles through the 28 dividend fortresses.
- Hunt for mispriced opportunities by scanning the 75 high quality undiscovered gems that pair solid fundamentals with limited market attention.
- Reduce downside shocks by filtering for sturdier balance sheets using the list of solid balance sheet and fundamentals (23 results).
This article by Simply Wall St is general in nature. We provide commentary based on historical data and analyst forecasts only using an unbiased methodology and our articles are not intended to be financial advice. It does not constitute a recommendation to buy or sell any stock, and does not take account of your objectives, or your financial situation. We aim to bring you long-term focused analysis driven by fundamental data. Note that our analysis may not factor in the latest price-sensitive company announcements or qualitative material. Simply Wall St has no position in any stocks mentioned.
Have feedback on this article? Concerned about the content? Get in touch with us directly. Alternatively, email editorial-team@simplywallst.com