
NS Solutions (TSE:2327) Following Treasury Share Move Looks Fully Valued
NS Solutions (TSE:2327) has attracted fresh attention after a 30 September 2026 board meeting to consider disposing treasury shares as restricted stock to the representative director and president of a subsidiary, putting governance incentives in focus.
For investors watching the ticker, NS Solutions now trades at ¥3,784, with the share price return down 13.57% year to date but supported by a 6.15% 1-year total shareholder return and a 131.42% 5-year total shareholder return, which highlights longer term metrics even as near term sentiment cools around events like the recent board decision on treasury stock incentives.
Spot under-the-radar peers reacting to similar governance and incentive shifts by scanning our curated 75 high quality undiscovered gems, which is aligned with NS Solutions' profile.NS Solutions now carries a mixed scorecard of recent share price weakness, longer term gains and fresh governance incentives. Does that combination still leave more upside potential than downside risk for new buyers at today’s valuation?
Preferred P/E of 22.4x for NS Solutions: Is it justified?
Valuation for NS Solutions starts with a clear message from the data. The shares trade on a P/E of 22.4x, which screens as expensive against both the JP IT industry average of 16.5x and a peer group sitting around 21.4x.
The P/E ratio compares the current share price to earnings per share and acts as a shorthand for how much investors are willing to pay for each unit of profit. For an IT solutions provider like NS Solutions, that figure often reflects expectations for steady earnings expansion, contract stability and the perceived reliability of cash generation.
On the growth side, NS Solutions has earnings that grew 10.6% per year over the past 5 years and 15.5% in the most recent year, with forecasts pointing to earnings growth of 7.9% per year and revenue growth of 5.2% per year. That mix suggests a business with positive but not rapid growth, so a P/E above both the industry average and the peer average implies the market is paying up for qualities such as high quality earnings, slightly improving profit margins at 7.9%, and an experienced board and management team.
Compared with the IT industry, the premium is clear. The current P/E of 22.4x is materially higher than the JP IT industry average of 16.5x and sits above the estimated fair P/E of 22.1x, which is a level the market could potentially gravitate toward if sentiment or growth expectations settle closer to broader sector norms.
Explore the SWS fair ratio for NS Solutions.
Result: Price-to-Earnings of 22.4x (OVERVALUED)
Still, the investment case around NS Solutions could shift quickly if earnings growth slows from recent trends or if the fresh stock-based incentives fail to translate into clear operational wins.
Find out about the key risks to this NS Solutions narrative.
Another view on NS Solutions’ value
The P/E screens NS Solutions as expensive, yet the SWS DCF model tells a quieter story. At ¥3,784, the shares sit about 2.4% below an estimated future cash flow value of roughly ¥3,875, which points to only a small cushion. Is that slim gap enough for you?
Look into how the SWS DCF model arrives at its fair value.
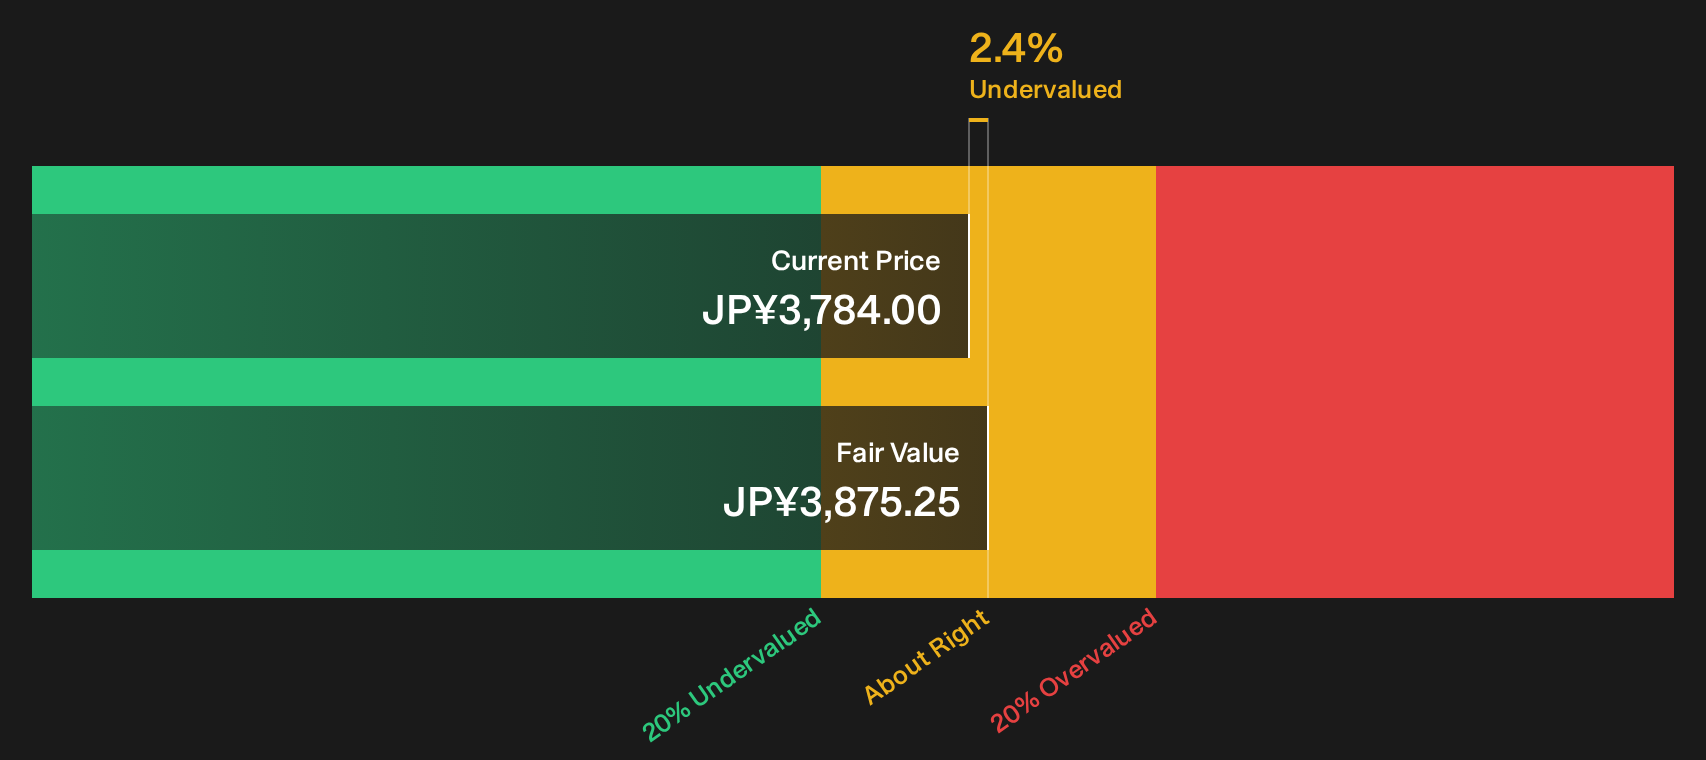
Simply Wall St performs a discounted cash flow (DCF) on every stock in the world every day (check out NS Solutions for example). We show the entire calculation in full. You can track the result in your watchlist or portfolio and be alerted when this changes, or use our stock screener to discover 15 high quality undervalued stocks. If you save a screener we even alert you when new companies match - so you never miss a potential opportunity.
Next Steps
Mixed messages on NS Solutions so far, or a coherent story that just needs closer inspection before sentiment moves again. To evaluate the three key rewards and one important warning sign that investors are weighing around NS Solutions, go straight to the 3 key rewards and 1 important warning sign
Looking for more investment ideas beyond NS Solutions?
If NS Solutions has sharpened your focus on quality and valuation, you can use that momentum to look for other opportunities before the market prices them in.
- Target potential bargains by running through the 15 high quality undervalued stocks and comparing price tags to underlying business strength.
- Build a sturdier core portfolio by filtering companies with healthier finances through the list of solid balance sheet and fundamentals (23 results).
- Look for overlooked opportunities by scanning the 75 high quality undiscovered gems before wider attention narrows the gap.
This article by Simply Wall St is general in nature. We provide commentary based on historical data and analyst forecasts only using an unbiased methodology and our articles are not intended to be financial advice. It does not constitute a recommendation to buy or sell any stock, and does not take account of your objectives, or your financial situation. We aim to bring you long-term focused analysis driven by fundamental data. Note that our analysis may not factor in the latest price-sensitive company announcements or qualitative material. Simply Wall St has no position in any stocks mentioned.
Have feedback on this article? Concerned about the content? Get in touch with us directly. Alternatively, email editorial-team@simplywallst.com