
Is SINOPEC Engineering (Group) (SEHK:2386) Expensive Following Its Boardroom Shake Up?
Leadership shake up puts governance in focus
SINOPEC Engineering (Group) (SEHK:2386) drew fresh attention after appointing Mr. ZHENG Lijun as board chairman and executive director, alongside committee reshuffles and the election of Mr. PENG Qianbing as a non executive director.
These boardroom changes land after a choppy stretch for SINOPEC Engineering (Group), with the share price at HK$5.265 posting a 1 day share price return of 2.33% but a 30 day share price return that fell 8.36%, even as the 5 year total shareholder return reached 95.47%.
Compare SINOPEC Engineering (Group)'s governance reset with other companies that pair board stability with balance sheet strength by scanning our hand picked list of solid balance sheet and fundamentals (207 results).
The boardroom reset arrives while SINOPEC Engineering (Group) trades below both analyst targets and intrinsic estimates. Does that valuation gap still look justified after the latest move in the share price?
Price-to-Earnings of 12.8x: Is it justified?
SINOPEC Engineering (Group) trades on a P/E of 12.8x at a last close of HK$5.265, which sits above several valuation markers and raises the question of whether investors are paying a premium for its earnings profile.
The P/E ratio compares what the market is willing to pay per share against the company’s earnings per share, so a higher figure often reflects expectations for stronger profit growth or higher perceived quality. For an engineering and EPC contractor like SINOPEC Engineering (Group), this measure helps show how the market is weighing its project pipeline and earnings outlook against other listed peers.
Analyst data indicates that earnings are forecast to grow 19.8% per year, ahead of the wider Hong Kong market forecast of 11.3% per year. This can help explain why the stock trades above the peer average P/E of 9.9x and the Hong Kong Construction sector average of 12x. At the same time, a fair P/E level for the shares is estimated at 10x, which is materially lower than the current 12.8x and suggests that the market could move closer to that lower multiple if sentiment cools.
Relative to the estimated fair P/E and sector benchmarks, the current 12.8x looks demanding compared to both the peer average of 9.9x and the Hong Kong Construction industry average of 12x. Investors are effectively paying up for the expected improvement in earnings and quality indicators such as high quality earnings despite weaker recent margins.
Explore the SWS fair ratio for SINOPEC Engineering (Group).
Result: Price-to-Earnings of 12.8x (OVERVALUED)
Still, SINOPEC Engineering (Group) faces risks if forecast earnings growth disappoints, or if its large exposure to PRC projects makes cash flows more volatile.
Find out about the key risks to this SINOPEC Engineering (Group) narrative.
Another view on SINOPEC Engineering (Group)'s value
The SWS DCF model points in the opposite direction to the P/E story. At around HK$5.27, SINOPEC Engineering (Group) trades about 17% below the modelled future cash flow value of HK$6.34, which frames the stock as undervalued rather than expensive. Which signal do you trust more in your process?
Look into how the SWS DCF model arrives at its fair value.
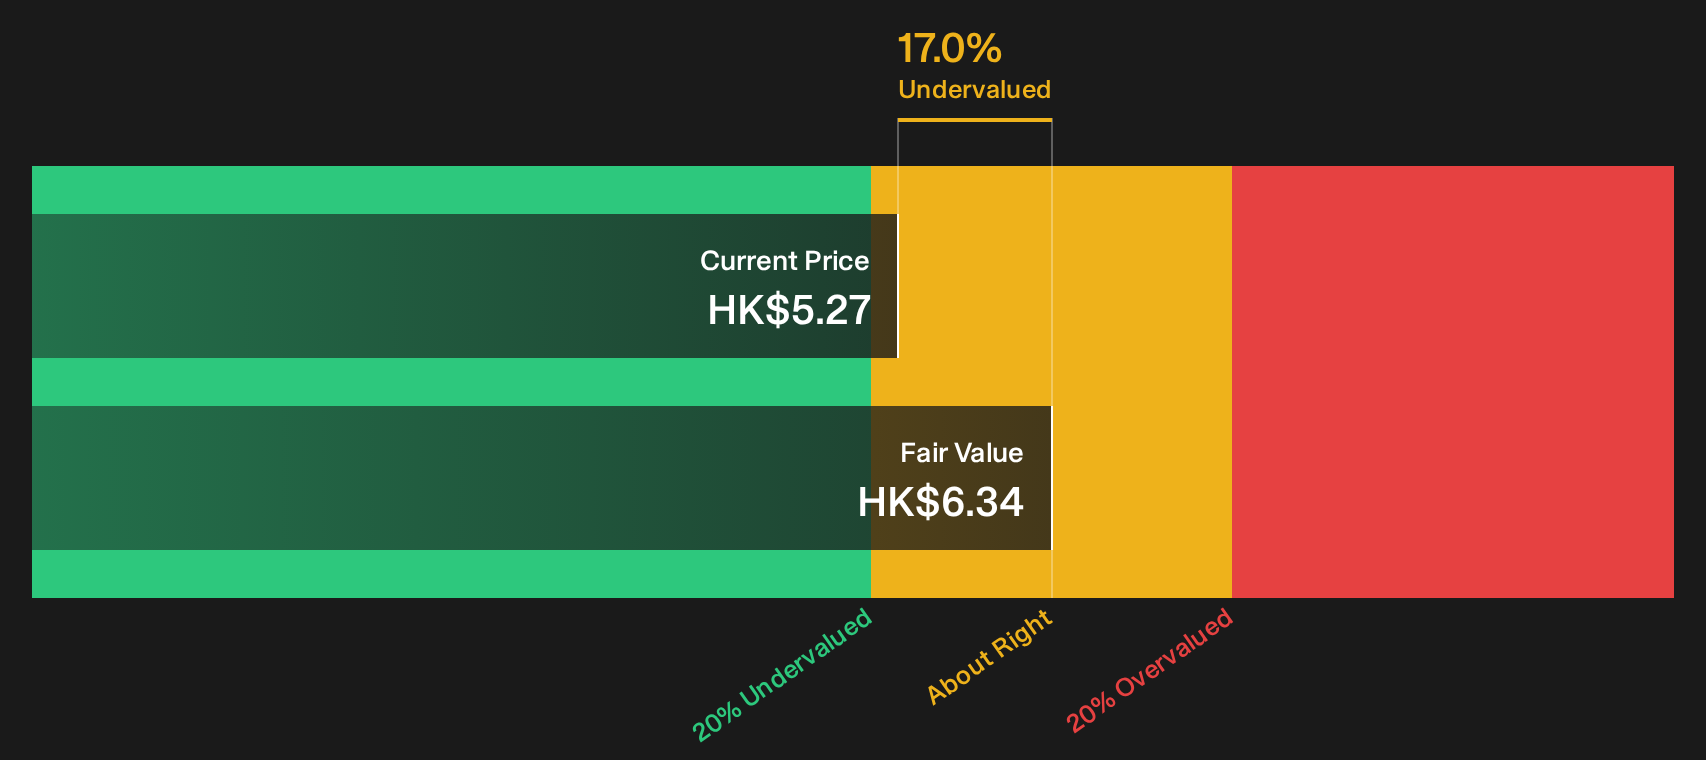
Simply Wall St performs a discounted cash flow (DCF) on every stock in the world every day (check out SINOPEC Engineering (Group) for example). We show the entire calculation in full. You can track the result in your watchlist or portfolio and be alerted when this changes, or use our stock screener to discover 185 high quality undervalued stocks. If you save a screener we even alert you when new companies match - so you never miss a potential opportunity.
Next Steps
Mixed signals on SINOPEC Engineering (Group) so far. If you want to stress test the upside story against the potential downsides, start by weighing the 3 key rewards and 2 important warning signs.
Looking for more SINOPEC Engineering (Group) style ideas?
Do not stop your research with SINOPEC Engineering (Group). A few minutes with the right tools can surface opportunities that fit your risk, income, and value preferences.
- Target resilient balance sheets and steady fundamentals by scanning the list of solid balance sheet and fundamentals (207 results) that match your comfort with financial strength.
- Hunt for potential value opportunities before the crowd by running the 185 high quality undervalued stocks and filtering for businesses that line up with your thesis.
- Build a watchlist of income focused ideas by reviewing the 225 dividend fortresses that align with your approach to yield and payout stability.
This article by Simply Wall St is general in nature. We provide commentary based on historical data and analyst forecasts only using an unbiased methodology and our articles are not intended to be financial advice. It does not constitute a recommendation to buy or sell any stock, and does not take account of your objectives, or your financial situation. We aim to bring you long-term focused analysis driven by fundamental data. Note that our analysis may not factor in the latest price-sensitive company announcements or qualitative material. Simply Wall St has no position in any stocks mentioned.
Have feedback on this article? Concerned about the content? Get in touch with us directly. Alternatively, email editorial-team@simplywallst.com