
Karman Holdings (KRMN) Sinks Despite Growth As Fair Value Debate Heats Up
Karman Holdings (KRMN) has drawn fresh attention after its share price closed at US$31.39, leaving the stock down 59% over the past year despite reporting annual revenue and net income growth in the double digits.
The recent slide has been steep. Karman Holdings’ share price return has fallen 21.5% over the past month and 37.3% over the past quarter, leaving the year to date share price return down 59.2% and the 1 year total shareholder return lower by 59.0%. This suggests momentum has been fading as investors reassess growth potential against perceived execution and sector risks.
Spot opportunities beyond Karman Holdings by scanning a curated 20 high quality undiscovered gems that are attracting attention despite recent share price pressure.The selloff in Karman Holdings comes despite reported rapid growth in revenue and net income. The key issue now is whether the valuation reflects a weaker business or simply a sharp swing in sentiment.
Most Popular Narrative: 70% Undervalued
Karman Holdings closed at $31.39 while the most followed narrative on the stock pegs fair value close to $105.60. That gap has turned the focus squarely onto whether recent price weakness reflects fundamentals or fear.
This is not a story of a company in distress that the market is correctly marking down. It is a hypergrowth defense compounder that ran too far, too fast, got punished for modest EPS misses, and is now pricing in a much more pessimistic scenario than the fundamentals support.
See why 48 investors see Karman Holdings as 70% undervalued.
The narrative, according to FundamentalFlow, frames Karman Holdings as materially undervalued relative to an assessed fair value of $105.60, a level that sits far above the recent share price. That viewpoint leans heavily on the combination of very large 1 year earnings growth, forecast annual earnings expansion above 50%, and revenue growth forecasts comfortably above 20% a year.
Supporters of this thesis often point to several building blocks. Earnings grew very strongly over the past year and have also risen quickly over a 5 year window, net profit margins improved from 2% to 6.3%, and earnings are forecast to grow 56.36% per year while revenue is projected to rise 27.7% annually. On top of that, Karman Holdings is expected to deliver a return on equity of 23.9% in three years, and its earnings growth over the past year exceeded the wider Aerospace & Defense industry.
There is also an emphasis on quality. The business is assessed as having high quality earnings, and profit or revenue is expected to continue growing. The board has a high proportion of independent directors at 86%, which some investors view as a positive governance signal, even though both the management team and board are relatively new in tenure terms.
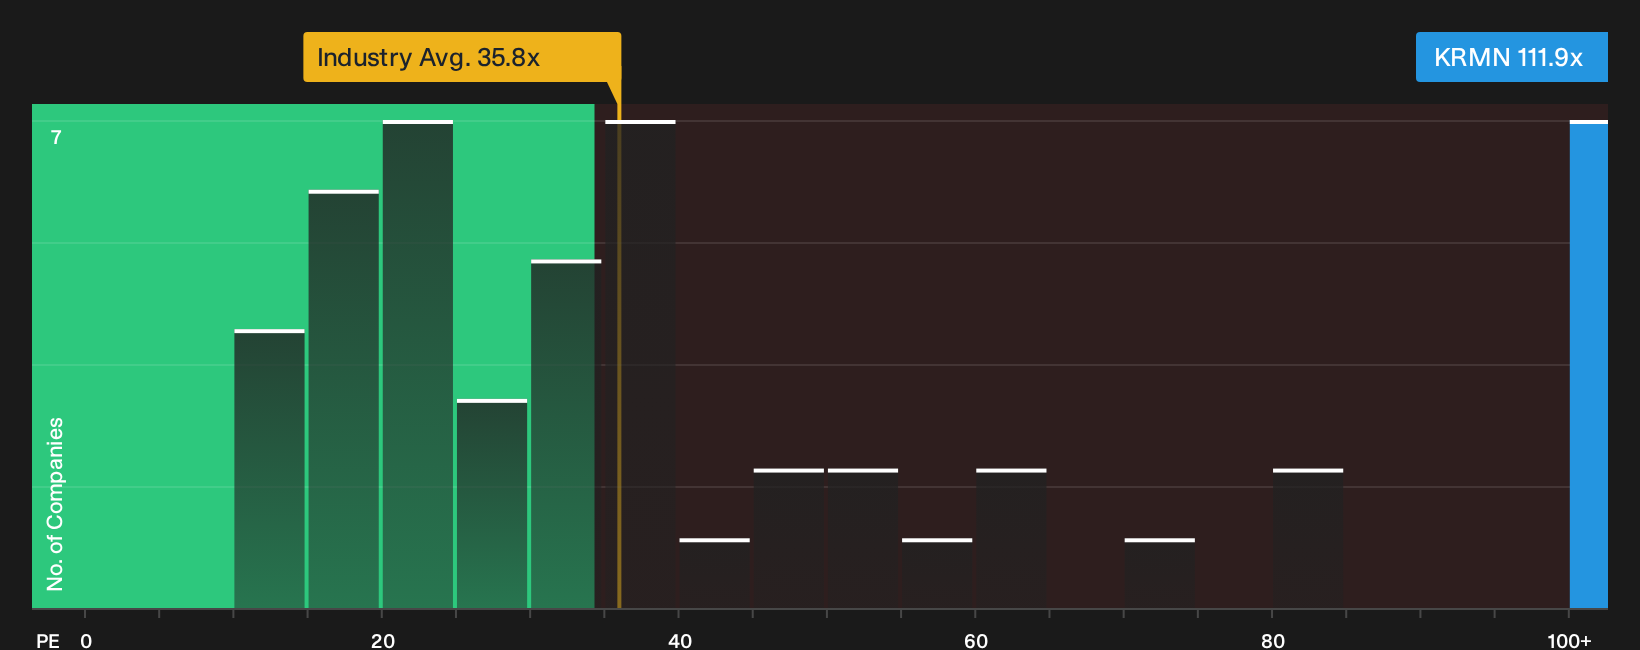
The same narrative does not ignore pressure points. Karman Holdings trades on a P/E of 111.9x, which is described as expensive compared with both the peer average of 50.7x and the broader US Aerospace & Defense sector at 35.8x. That P/E is also above an estimated fair P/E of 76.1x, and the stock is indicated as trading above an estimated future cash flow value of $27.23 from the SWS DCF model. Interest payments are not well covered by earnings, all liabilities are funded by higher risk borrowing rather than customer deposits, and 1 year returns have lagged both the industry and the wider US market.
On balance, the popular narrative argues that strong growth in revenue and earnings, improving profitability and a forecast step up in returns on equity outweigh concerns about leverage, costly funding and a rich P/E ratio. That tension between powerful growth forecasts and a stretched multiple is what drives the wide gap between the narrative fair value and where Karman Holdings currently trades.
Result: Fair Value of $105.60 (UNDERVALUED)
Still, Karman Holdings faces real pressure if high leverage coincides with weaker earnings or if concentrated defense customers delay programs and constrain near term cash generation.
Find out about the key risks to this Karman Holdings narrative.
Another View on Karman Holdings’ Valuation
The story shifts when you look at Karman Holdings through its P/E. The stock trades on 111.9x earnings, compared with 50.7x for peers and 35.8x for the broader US Aerospace & Defense industry. The fair ratio sits at 76.1x, which suggests a lot of multiple risk if sentiment cools again.
That gap raises a simple question for investors. Is this premium still justified by future growth expectations, or has the share price already pulled too far ahead of what the business can deliver?
See what the numbers say about this price — find out in our valuation breakdown.
Next Steps
Given the mix of strong growth metrics and stretched valuation multiples around Karman Holdings, it makes sense to review the full data and decide where you land. To see how the upside case compares with the downsides that investors are flagging, start with the 2 key rewards and 1 important warning sign.
Looking for more investment ideas beyond Karman Holdings?
If Karman Holdings has caught your eye, do not stop there. Use the screener to surface fresh ideas that match your risk profile and income goals.
- Target resilient compounding potential by reviewing a 31 resilient stocks with low risk scores that may appeal if you prefer steadier returns over sharp swings.
- Hunt for quality at a discount through a curated 29 high quality undervalued stocks that filters for strong fundamentals priced below their assessed worth.
- Build reliable income streams by scanning a focused 8 dividend fortresses that highlights higher yielding companies with robust payout profiles.
This article by Simply Wall St is general in nature. We provide commentary based on historical data and analyst forecasts only using an unbiased methodology and our articles are not intended to be financial advice. It does not constitute a recommendation to buy or sell any stock, and does not take account of your objectives, or your financial situation. We aim to bring you long-term focused analysis driven by fundamental data. Note that our analysis may not factor in the latest price-sensitive company announcements or qualitative material. Simply Wall St has no position in any stocks mentioned.
Have feedback on this article? Concerned about the content? Get in touch with us directly. Alternatively, email editorial-team@simplywallst.com