
Evergy (EVRG), Why Is The Utility Drawing Fresh Attention?
Evergy (EVRG) has attracted fresh attention after recent share performance data highlighted mixed returns, with gains over the year to date but a decline over the past 3 months challenging investor conviction.
Evergy’s price action reflects that tension between improving sentiment and lingering caution, with a 7 day share price return of 2.37% compared with a 90 day share price return that has declined 5.84% and a year to date share price gain of 9.88%.
Scan other regulated utilities that show similar mixed return profiles and balance-sheet resilience with our hand-picked list of 31 resilient stocks with low risk scores while you keep Evergy on your radar.
Evergy has climbed year to date but slipped over the past quarter, which leaves you weighing a fresh entry now against waiting for a pullback. What does the current valuation actually imply about that trade off?
Most Popular Narrative: 12% Undervalued
The most followed Evergy narrative points to a fair value of $91.27 per share, which is above the last close at $80.30 and presents today’s price as a discount to those long term expectations.
Strong anticipated growth in electricity demand from large-scale data centers, advanced manufacturing such as Panasonic's EV battery plant, and other commercial users remains central to Evergy's outlook, with signed long-term agreements totaling about 3 GW of large-load demand that are expected to support future revenue and earnings as these customers ramp through 2030.
See why 14 investors see Evergy as 12% undervalued.
Result: Fair Value of $91.27 (UNDERVALUED)
Still, Evergy’s heavy capital plan, funded with both debt and regular equity issuance, together with possible regulatory pushback on higher bills, could pressure the thesis.
Find out about the key risks to this Evergy narrative.
Another View: Evergy Through A Cash Flow Lens
The analyst narrative frames Evergy as undervalued around $80.30 against a fair value of $91.27, yet the SWS DCF model points in the opposite direction. On that cash flow work, the stock screens as expensive, with an estimated value of $61.24 that sits well below the current share price. Which story do you trust more when real money is on the line?
Look into how the SWS DCF model arrives at its fair value.
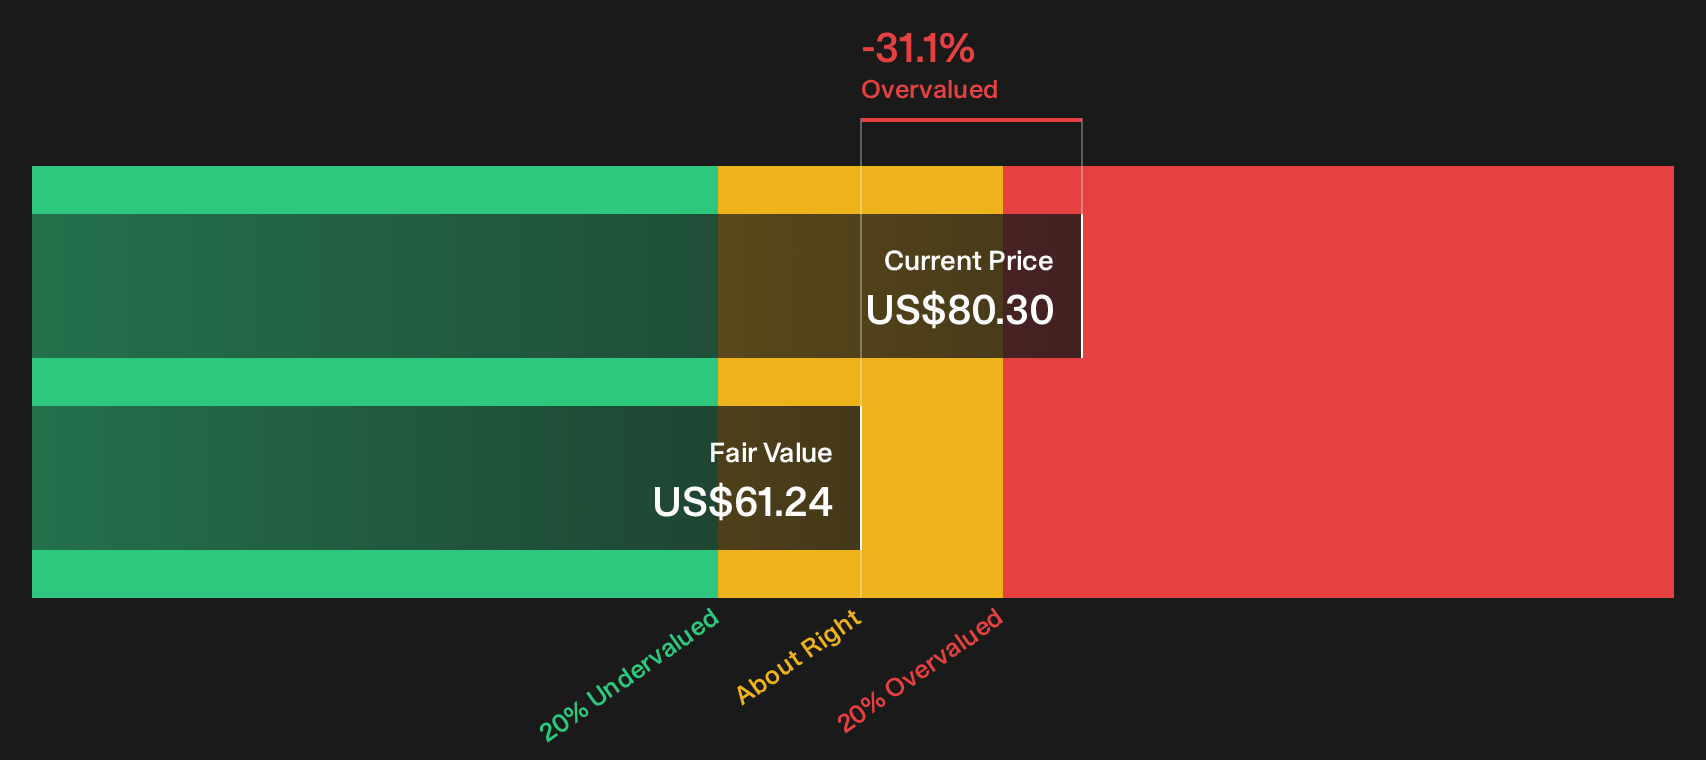
Simply Wall St performs a discounted cash flow (DCF) on every stock in the world every day (check out Evergy for example). We show the entire calculation in full. You can track the result in your watchlist or portfolio and be alerted when this changes, or use our stock screener to discover 29 high quality undervalued stocks. If you save a screener we even alert you when new companies match - so you never miss a potential opportunity.
Next Steps
Mixed signals on Evergy can pull you in both directions, so move quickly, review the full picture, and weigh the 2 key rewards and 2 important warning signs against your own judgment.
Looking for more investment ideas beyond Evergy?
If Evergy has you thinking harder about quality and price, widen your net and pressure test your next move with focused stock lists built for different goals.
- Target resilience first by scanning companies with strong finances using our list of solid balance sheet and fundamentals (25 results) to see which businesses back their story with robust balance sheets.
- Hunt for mispriced quality and sort through 20 high quality undiscovered gems that pair sound fundamentals with limited attention from the broader market.
- Prioritize income and review 7 dividend fortresses that aim to combine higher yields with durability so your returns are not relying on price moves alone.
This article by Simply Wall St is general in nature. We provide commentary based on historical data and analyst forecasts only using an unbiased methodology and our articles are not intended to be financial advice. It does not constitute a recommendation to buy or sell any stock, and does not take account of your objectives, or your financial situation. We aim to bring you long-term focused analysis driven by fundamental data. Note that our analysis may not factor in the latest price-sensitive company announcements or qualitative material. Simply Wall St has no position in any stocks mentioned.
Have feedback on this article? Concerned about the content? Get in touch with us directly. Alternatively, email editorial-team@simplywallst.com