
OMRON (TSE:6645) Could Be 57% Above Fair Value As Valuation Debate Heats Up
OMRON (TSE:6645) is back on investor screens after a recent move in its share price. This is prompting closer attention to how its diversified automation and healthcare operations tie into the current valuation debate.
Recent moves in OMRON's share price sit on top of a strong run, with a 62.31% year-to-date share price return and a 52.89% 1-year total shareholder return. However, the 5-year total shareholder return is down 30.35%, suggesting that current momentum is a relatively recent shift in how investors are weighing its growth potential against past risks.
Scan beyond OMRON's surge and size up other robotics and automation players with the hand picked 87 robotics and automation stocks that could be setting up for the next leg of momentum.
OMRON now trades only about 7% below the average analyst target, even as some models flag a steep premium to estimated intrinsic value. Is the market overpaying for the rebound or still discounting old worries?
Price-to-Earnings of 29.3x: Is it justified?
On simple earnings math, OMRON trades on a P/E of 29.3x, which places the stock on a rich valuation compared to several reference points in its own data set.
The P/E ratio compares the current share price to earnings per share and effectively shows how many years of profit the market is willing to pay for today. For an automation and healthcare equipment group like OMRON, this metric often reflects how investors weigh future earnings potential against execution risks in its industrial and medical device lines.
The 29.3x figure appears expensive relative to the estimated fair P/E of 22.1x. It also sits well above the JP Electronic industry average of 16.8x, which suggests the market is placing a much higher price on each yen of OMRON's earnings than on sector peers and above the level the fair ratio model suggests the multiple could move toward.
Explore the SWS fair ratio for OMRON.
Result: Price-to-Earnings of 29.3x (OVERVALUED)
Still, OMRON’s premium multiple could come under pressure if industrial automation demand softens or healthcare device revenues fail to match current optimism.
Find out about the key risks to this OMRON narrative.
Another View on OMRON's Value
There is a sharp contrast when the SWS DCF model is brought into the picture. On this framework, OMRON at ¥6,486 trades well above an estimated future cash flow value of ¥4,130.47, which points to an overvalued signal rather than a simple quality premium. Which lens do you trust more when growth cools or accelerates?
Look into how the SWS DCF model arrives at its fair value.
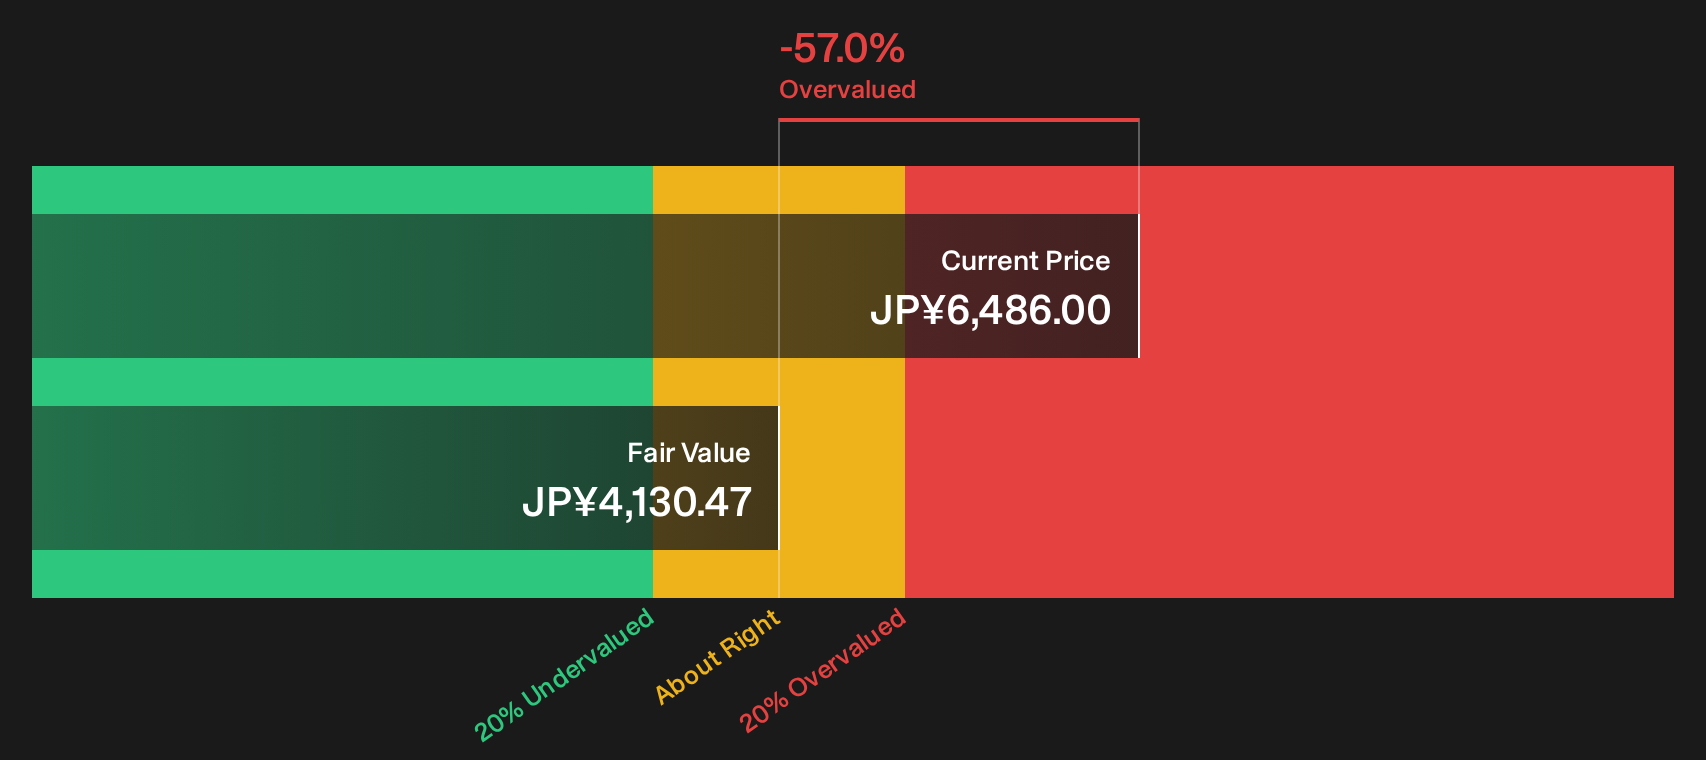
Simply Wall St performs a discounted cash flow (DCF) on every stock in the world every day (check out OMRON for example). We show the entire calculation in full. You can track the result in your watchlist or portfolio and be alerted when this changes, or use our stock screener to discover 15 high quality undervalued stocks. If you save a screener we even alert you when new companies match - so you never miss a potential opportunity.
Next Steps
Mixed messages on OMRON's value and risk profile can feel messy. Move quickly, review the underlying data, and evaluate both the bullish and cautious perspectives yourself using the 2 key rewards and 1 important warning sign.
Looking for more investment ideas beyond OMRON?
If OMRON has your attention, do not stop there. Broaden your watchlist with a few targeted ideas that match different investing styles.
- Chase mispriced quality by checking stocks that combine strong fundamentals with appealing valuations through the 15 high quality undervalued stocks.
- Prioritise resilience and capital protection by scanning companies with robust finances using the 22 resilient stocks with low risk scores.
- Hunt for earlier stage opportunities with solid foundations by running the 75 high quality undiscovered gems before others catch on.
This article by Simply Wall St is general in nature. We provide commentary based on historical data and analyst forecasts only using an unbiased methodology and our articles are not intended to be financial advice. It does not constitute a recommendation to buy or sell any stock, and does not take account of your objectives, or your financial situation. We aim to bring you long-term focused analysis driven by fundamental data. Note that our analysis may not factor in the latest price-sensitive company announcements or qualitative material. Simply Wall St has no position in any stocks mentioned.
Have feedback on this article? Concerned about the content? Get in touch with us directly. Alternatively, email editorial-team@simplywallst.com