
Tradeweb Markets (TW) Volume Momentum Keeps The Undervalued Narrative In Play
Tradeweb Markets (TW) just released operating metrics for September and the third quarter of 2026, giving investors a fresh look at how much activity is flowing across its electronic trading platforms.
On the price side, Tradeweb Markets shares trade at US$107.54 after a 7-day share price return of 6.89% and a 90-day share price return of 7.70%. The 3-year total shareholder return of 30.82% points to momentum that has been building rather than fading.
Scan other electronic trading platforms that could be seeing similar volume momentum by reviewing our hand-picked list of 19 high quality undiscovered gems alongside Tradeweb Markets in your watchlist.
Bulls will point to Tradeweb Markets’ recent volume surge and steady share gains. Bears will focus on how much optimism is already in the price. Which side do the current valuation markers support next?
Most Popular Narrative: 13% Undervalued
On the most followed view, Tradeweb Markets carries a fair value of about $123.64. This sits above the last close at $107.54 and is based on a discount rate of 7.85% that anchors the long term cash flow story.
Ongoing migration of fixed income and derivatives trading from manual and voice channels to electronic platforms, supported by growth in institutional U.S. Treasuries, global swaps and U.S. credit protocols such as RFQ, portfolio trading and all-to-all, can support higher transaction volumes and fee revenue for Tradeweb Markets.
See why 12 investors see Tradeweb Markets as 13% undervalued.
Result: Fair Value of $123.64 (UNDERVALUED)
Still, the narrative around Tradeweb Markets can crack if expense growth near the top of guidance persists or if quarterly revenue disappointments continue to reset expectations.
Find out about the key risks to this Tradeweb Markets narrative.
Another View On Tradeweb Markets Using Cash Flows
The analyst narrative points to a fair value of $123.64 for Tradeweb Markets, yet the Simply Wall St DCF model paints a stricter picture. On that framework, the shares screen as expensive at $107.54 versus an estimated future cash flow value of $77.96. Which story do you trust more, earnings or cash flows?
Look into how the SWS DCF model arrives at its fair value.
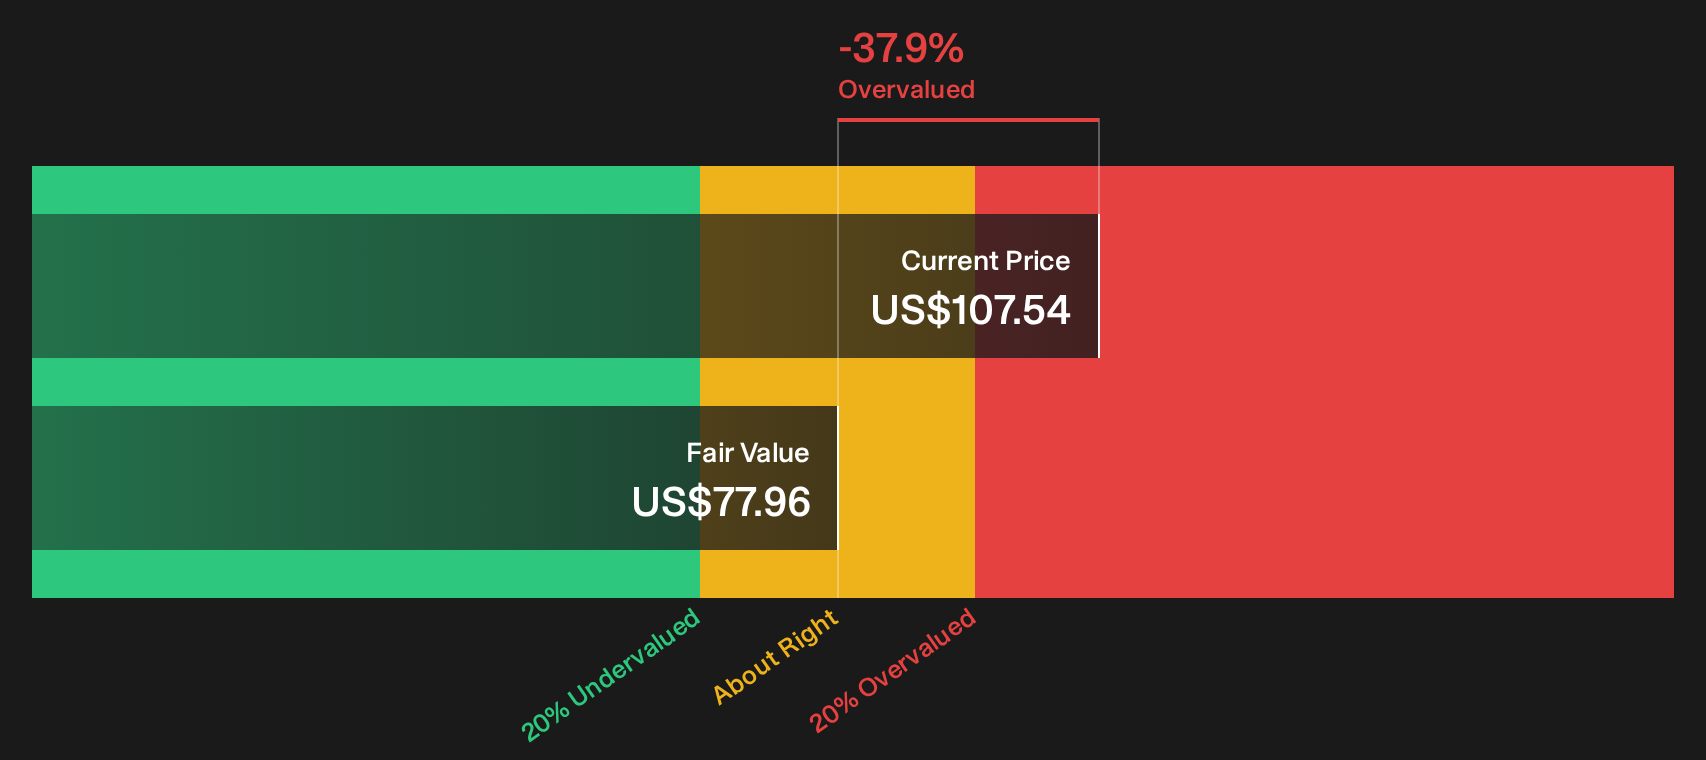
Simply Wall St performs a discounted cash flow (DCF) on every stock in the world every day (check out Tradeweb Markets for example). We show the entire calculation in full. You can track the result in your watchlist or portfolio and be alerted when this changes, or use our stock screener to discover 27 high quality undervalued stocks. If you save a screener we even alert you when new companies match - so you never miss a potential opportunity.
Next Steps
Feeling the bullish tilt in this Tradeweb Markets story, but not entirely convinced either way yet? Move fast, test the assumptions against the full reward profile, and review the 3 key rewards.
Looking for more Tradeweb Markets style investment ideas?
If Tradeweb Markets has sharpened your focus, do not stop here. Broaden your opportunity set by scanning other stocks through the Simply Wall St Screener today.
- Target resilient income by reviewing companies in the 8 dividend fortresses that could help anchor the yield side of your portfolio.
- Hunt for potential mispriced opportunities using the 27 high quality undervalued stocks that filters for quality businesses trading below their estimated worth.
- Dial down portfolio volatility by focusing on the 31 resilient stocks with low risk scores that highlights businesses with stronger financial and risk profiles.
This article by Simply Wall St is general in nature. We provide commentary based on historical data and analyst forecasts only using an unbiased methodology and our articles are not intended to be financial advice. It does not constitute a recommendation to buy or sell any stock, and does not take account of your objectives, or your financial situation. We aim to bring you long-term focused analysis driven by fundamental data. Note that our analysis may not factor in the latest price-sensitive company announcements or qualitative material. Simply Wall St has no position in any stocks mentioned.
Have feedback on this article? Concerned about the content? Get in touch with us directly. Alternatively, email editorial-team@simplywallst.com