
Art Group Holdings (SEHK:565) Swung To A Full Year Loss, Is It Fully Priced?
Art Group Holdings earnings reversal puts guidance into focus
Art Group Holdings (SEHK:565) has moved into the spotlight after full year results to June 30, 2026 showed a net loss of HK$17.76 million, reversing from net income a year earlier.
The earnings swing landed on a stock that has already been volatile. Art Group Holdings has a 1-day share price return of 11.9%, but a 7-day share price return that fell 16.1%. The year-to-date share price return of 177.7% and a 1-year total shareholder return of 179.7% point to strong longer term momentum despite recent turbulence.
Compare Art Group Holdings' swing into loss with other property operators on the move by scanning our hand picked list of solid balance sheet and fundamentals (206 results) in the same space.
Art Group Holdings now couples a sharp earnings reversal with a share price that has surged over the past year. Does that combination still leave enough upside on the table for new buyers once valuation is factored in?
Price-to-book of 550x for Art Group Holdings: Is it justified?
On traditional valuation metrics, Art Group Holdings looks very expensive. The stock trades on a P/B ratio of 550.2x, compared with about 0.2x for the wider Hong Kong real estate group and 1.7x for its closer peer set.
P/B compares the market value of the equity to the accounting value of net assets on the balance sheet. For a property operator where assets are a key part of the story, this ratio often gives investors a quick shorthand for how much of a premium, or discount, the market is placing on those assets and the income streams tied to them.
When the P/B multiple is this elevated, the market is effectively paying a very large premium over book value. That can suggest traders are pricing in strong future returns on equity or some form of scarcity value around the assets. It can also mean expectations leave little room for disappointment if the business remains unprofitable.
Against both the Hong Kong real estate industry average and the peer group, Art Group Holdings trades at a multiple that is multiples higher. This is a strong signal that the shares are richly valued on this measure.
See what the numbers say about this price — find out in our valuation breakdown.
Result: Price-to-book of 550.2x (OVERVALUED)
Still, Art Group Holdings faces clear risks if rental demand in its Chinese malls weakens, or if any asset revaluation shifts book value closer to the traded price.
Find out about the key risks to this Art Group Holdings narrative.
Another view on Art Group Holdings valuation
Book value points one way, but the SWS DCF model goes even further. It estimates the future cash flow value of Art Group Holdings at around HK$0.37 per share, compared with the current HK$3.86 price. This flags the stock as heavily overvalued on this lens. Which signal do you trust more?
Look into how the SWS DCF model arrives at its fair value.
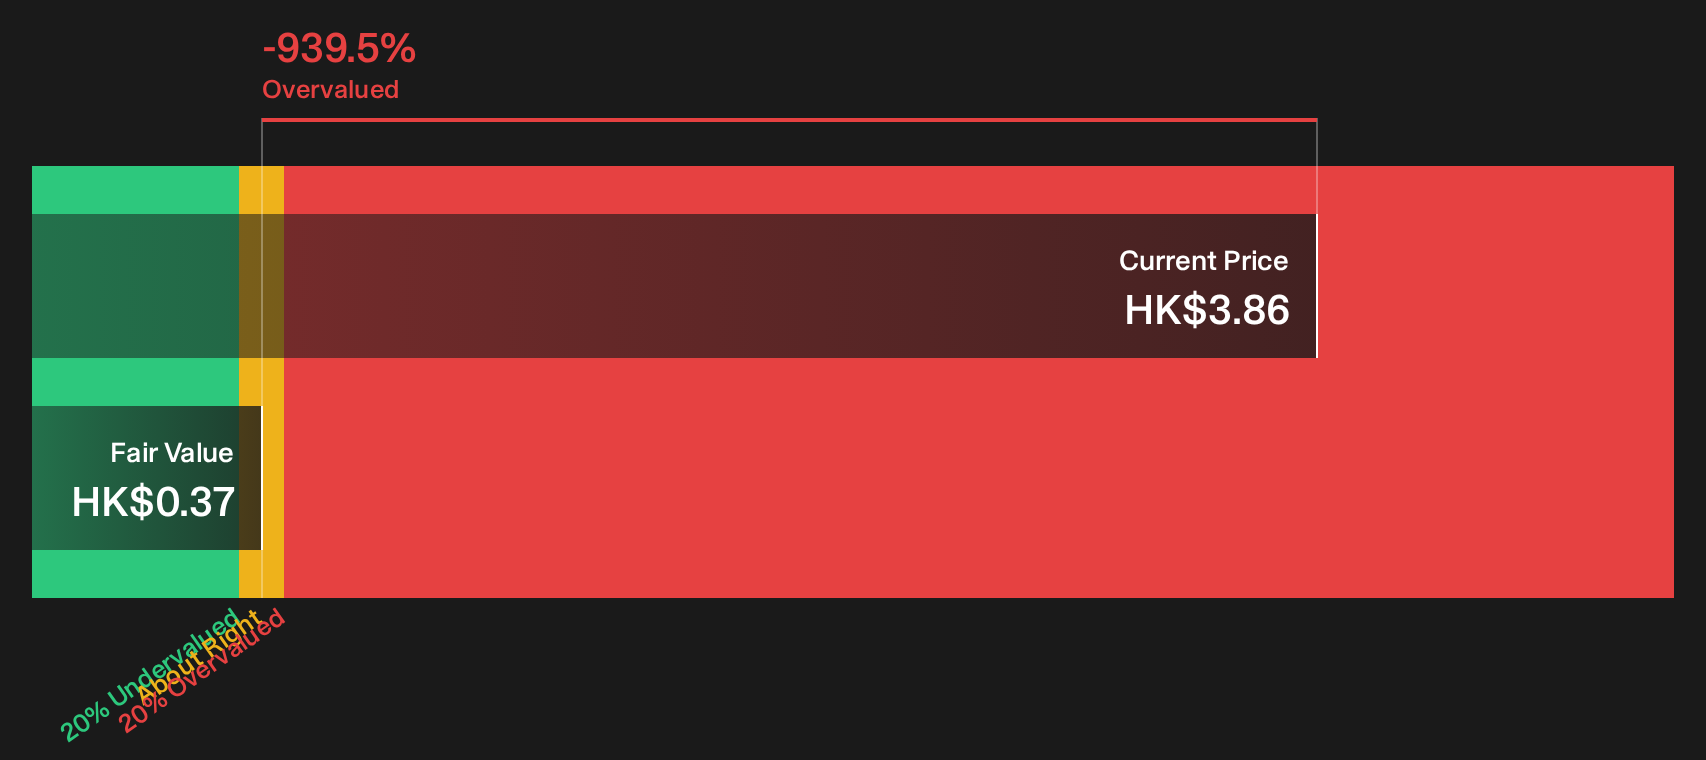
Simply Wall St performs a discounted cash flow (DCF) on every stock in the world every day (check out Art Group Holdings for example). We show the entire calculation in full. You can track the result in your watchlist or portfolio and be alerted when this changes, or use our stock screener to discover 184 high quality undervalued stocks. If you save a screener we even alert you when new companies match - so you never miss a potential opportunity.
Next Steps
Worried the tone around Art Group Holdings has turned too cautious or not cautious enough, given the flagged risks? Take a few minutes to review the underlying data and disclosures yourself, then weigh that against the 1 important warning sign.
Looking for more Art Group Holdings style investment ideas?
If Art Group Holdings has sharpened your focus on valuation and risk, do not stop here. Use the screeners below to pinpoint other opportunities that fit your approach.
- Target potential mispricings by reviewing companies flagged as undervalued on both quality and balance sheet strength via the 184 high quality undervalued stocks.
- Strengthen your income toolkit by checking out businesses that combine sizeable yields with more robust balance sheets using the 170 dividend fortresses.
- Prioritise capital preservation by scanning for businesses with lower risk profiles through the 227 resilient stocks with low risk scores.
This article by Simply Wall St is general in nature. We provide commentary based on historical data and analyst forecasts only using an unbiased methodology and our articles are not intended to be financial advice. It does not constitute a recommendation to buy or sell any stock, and does not take account of your objectives, or your financial situation. We aim to bring you long-term focused analysis driven by fundamental data. Note that our analysis may not factor in the latest price-sensitive company announcements or qualitative material. Simply Wall St has no position in any stocks mentioned.
Have feedback on this article? Concerned about the content? Get in touch with us directly. Alternatively, email editorial-team@simplywallst.com