
Keyence (TSE:6861) Rallies Again, But Is The Valuation Already Fully Priced In?
Keyence (TSE:6861) drew fresh attention after its recent share price move, with the stock closing at ¥81,560. Investors are reassessing how the automation specialist’s financial profile aligns with these levels.
Recent trading has built on that move, with a 1-week share price return of 1.34% and a 90-day gain of 7.88% contributing to a strong year-to-date share price return of 42.64%. Keyence’s 1-year total shareholder return of 39.72% indicates momentum that has been building rather than fading.
Scan other robotics and automation plays showing similar momentum with our hand picked 87 robotics and automation stocks while Keyence’s recent share price move is front of mind.
Bulls see Keyence’s premium as justified by its automation footprint and recent returns. Bears focus on the rich valuation signals. Which side do the current numbers lean toward as you weigh what you are really paying?
Price-to-Earnings of 40.2x: Is it justified?
On simple earnings terms, the Keyence share price around ¥81,560 reflects a rich P/E of 40.2x, far above peers, which signals investors are paying a premium for each yen of profit.
The P/E ratio compares the stock price to earnings per share and is a quick way to see how much the market is willing to pay for current profitability. For a specialist in factory automation and sensors like Keyence, this metric often reflects expectations around product breadth, recurring industrial demand, and how reliably those earnings are generated.
Keyence’s earnings profile supports why some investors accept a higher tag. Profit has grown 10.3% per year over the past 5 years and 23.9% over the most recent year, with current net profit margins at 39.2% compared with 37% a year earlier, and the business is described as having high quality earnings. That said, forecasts point to earnings growth of 10.3% per year and revenue growth of 11.2% per year, which are described as ahead of the broader JP market but not significant in absolute terms, so the market is assigning a premium multiple well above what those growth rates alone would usually justify.
The comparison with peers is stark. The JP Electronic industry trades on an average P/E of 16.8x, and direct peers sit near 21.1x, while an estimated fair P/E ratio for Keyence is 24x. The current 40.2x valuation is therefore materially higher than both the sector and this fair ratio level, suggesting substantial optimism is already embedded and leaving less room if sentiment or growth expectations cool.
Explore the SWS fair ratio for Keyence.
Result: Price-to-Earnings of 40.2x (OVERVALUED)
Still, any wobble in industrial demand or a reset in expectations for Keyence’s premium P/E could quickly challenge the current bullish narrative.
Find out about the key risks to this Keyence narrative.
Another view on what Keyence is worth
One model built on future cash flows paints a much harsher picture. Our DCF model suggests a value around ¥24,174.54 per share, which is far below the current ¥81,560 level and points to Keyence as overvalued on that lens. Which signal do you trust more when the gap is this wide?
Look into how the SWS DCF model arrives at its fair value.
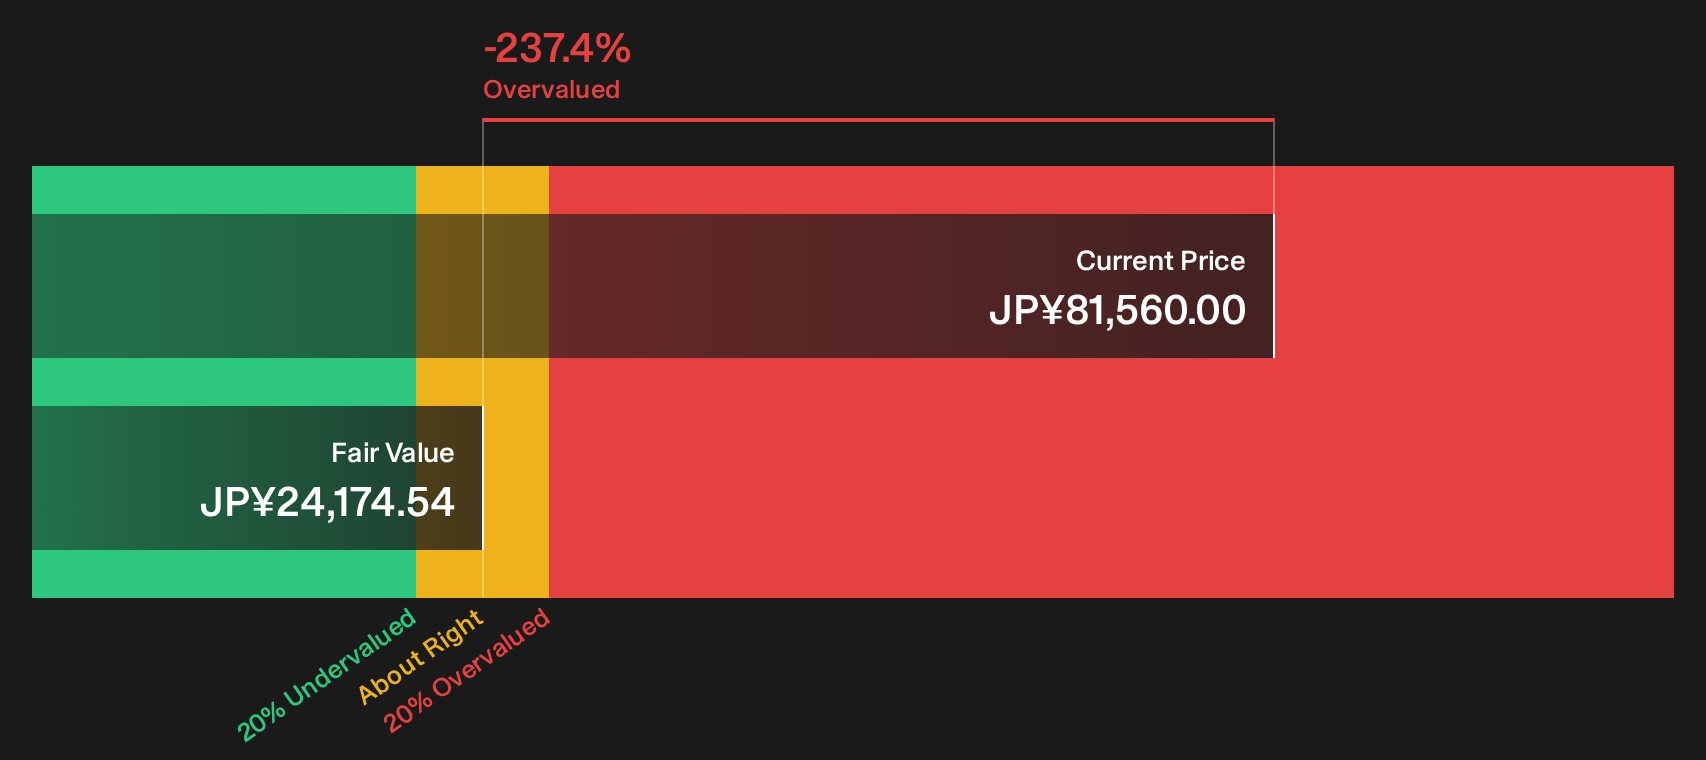
Simply Wall St performs a discounted cash flow (DCF) on every stock in the world every day (check out Keyence for example). We show the entire calculation in full. You can track the result in your watchlist or portfolio and be alerted when this changes, or use our stock screener to discover 15 high quality undervalued stocks. If you save a screener we even alert you when new companies match - so you never miss a potential opportunity.
Next Steps
Sentiment in this piece might feel cautious, yet pricing on Keyence rarely waits for investors to get perfectly comfortable. Act promptly on the data, compare the upside signals for yourself, and weigh them against the risks by reviewing the 2 key rewards
Looking for more ideas beyond Keyence?
If Keyence feels fully priced, do not stop there. Use the Simply Wall Street Screener to hunt for fresh opportunities before the market turns its attention.
- Target potential value plays that pair quality with attractive pricing through our 15 high quality undervalued stocks.
- Build a more resilient portfolio by scanning companies with stronger finances using the list of solid balance sheet and fundamentals (23 results).
- Spot opportunities that many investors may be overlooking by running the 75 high quality undiscovered gems.
This article by Simply Wall St is general in nature. We provide commentary based on historical data and analyst forecasts only using an unbiased methodology and our articles are not intended to be financial advice. It does not constitute a recommendation to buy or sell any stock, and does not take account of your objectives, or your financial situation. We aim to bring you long-term focused analysis driven by fundamental data. Note that our analysis may not factor in the latest price-sensitive company announcements or qualitative material. Simply Wall St has no position in any stocks mentioned.
Have feedback on this article? Concerned about the content? Get in touch with us directly. Alternatively, email editorial-team@simplywallst.com