
KE Holdings Among 3 Stocks Estimated To Be Trading Below Intrinsic Value
The United States market has shown positive momentum, rising 2.2% over the last week and up 14% over the past year, with earnings projected to grow by 18% annually. In this environment, identifying stocks trading below their intrinsic value can provide investors with opportunities for potential gains as these stocks may offer a favorable risk-reward balance.
Top 10 Undervalued Stocks Based On Cash Flows In The United States
| Name | Current Price | Fair Value (Est) | Discount (Est) |
| Zions Bancorporation National Association (ZION) | $62.85 | $121.73 | 48.4% |
| Textron (TXT) | $75.53 | $143.44 | 47.3% |
| SouthState Bank (SSB) | $100.95 | $192.39 | 47.5% |
| Provident Financial Services (PFS) | $22.28 | $42.20 | 47.2% |
| Northeast Bank (NBN) | $125.32 | $240.81 | 48% |
| M&T Bank (MTB) | $218.74 | $417.56 | 47.6% |
| KeyCorp (KEY) | $20.14 | $39.16 | 48.6% |
| Insteel Industries (IIIN) | $30.17 | $57.40 | 47.4% |
| Civista Bancshares (CIVB) | $26.71 | $53.30 | 49.9% |
| Addus HomeCare (ADUS) | $113.16 | $226.18 | 50% |
Let's dive into some prime choices out of the screener.
KE Holdings (BEKE)
Overview: KE Holdings Inc. operates an integrated online and offline platform for housing transactions and services in China, with a market cap of approximately $18.85 billion.
Operations: The company's revenue segments include Home Rental Services (CN¥20.98 billion), New Home Transaction Services (CN¥27.94 billion), Existing Home Transaction Services (CN¥24.59 billion), Home Renovation and Furnishing (CN¥13.44 billion), and Emerging and Other Services (CN¥1.72 billion).
Estimated Discount To Fair Value: 33.8%
KE Holdings is trading at US$16.76, significantly below its estimated future cash flow value of US$25.31, suggesting potential undervaluation based on cash flows. Despite a revenue decline to CNY 43.43 billion for the first half of 2026, net income rose to CNY 3.88 billion from CNY 2.16 billion a year prior, indicating improved profitability. Analysts expect earnings growth of 16.84% annually, though this lags behind the broader market's anticipated growth rate of 17.7%.
- Our expertly prepared growth report on KE Holdings implies its future financial outlook may be stronger than recent results.
- Dive into the specifics of KE Holdings here with our thorough financial health report.
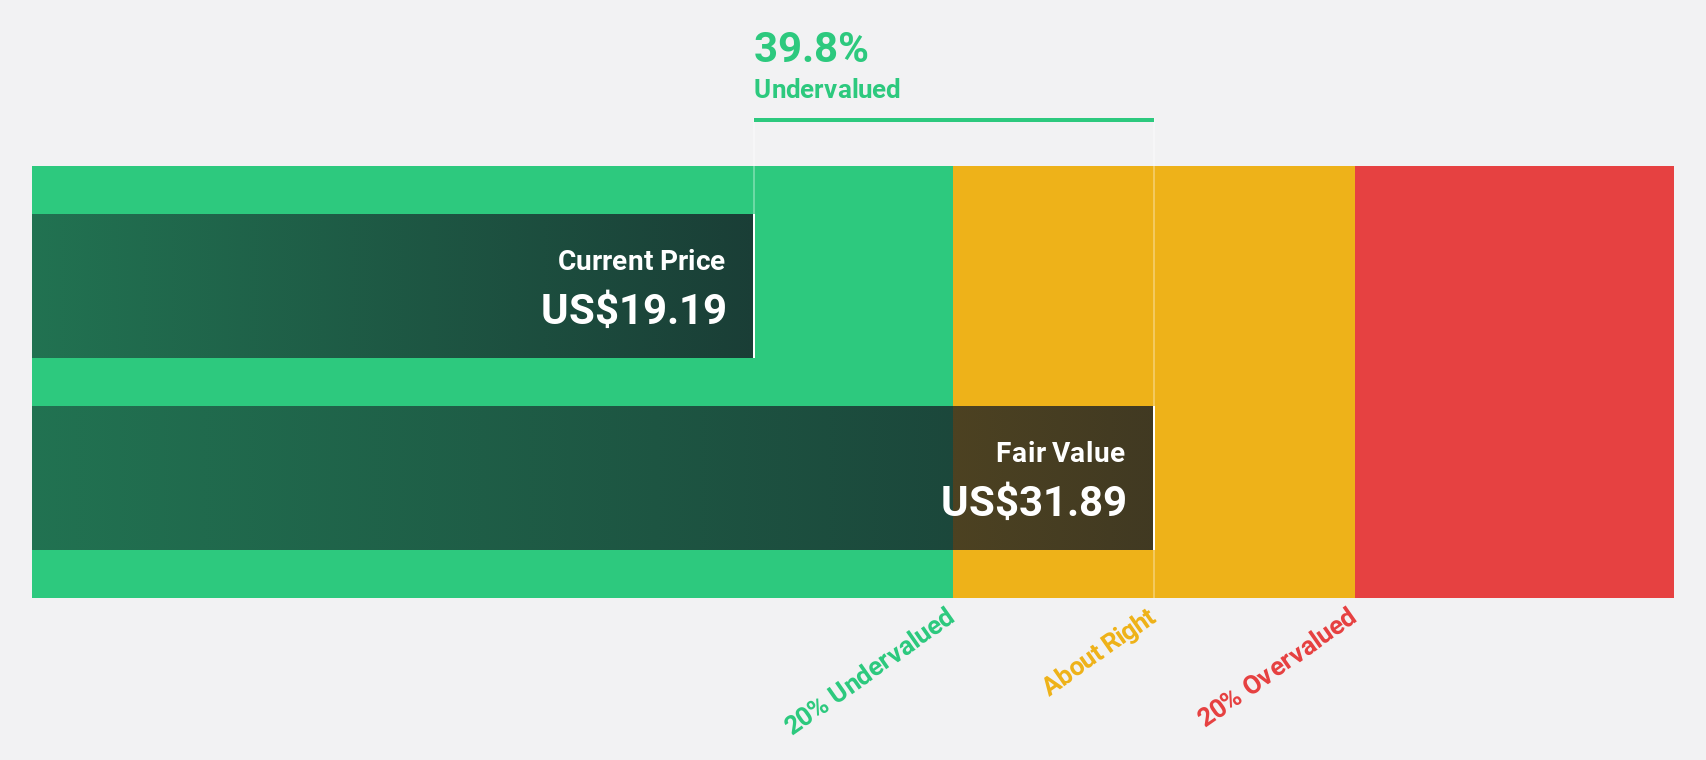
Crown Holdings (CCK)
Overview: Crown Holdings, Inc., along with its subsidiaries, operates in the packaging industry both in the United States and internationally, with a market cap of approximately $11.46 billion.
Operations: The company's revenue segments consist of $1.20 billion from Asia Pacific, $6.12 billion from Americas Beverage, $2.50 billion from European Beverage, and $2.07 billion from Transit Packaging, with additional contributions of $1.52 billion from other segments.
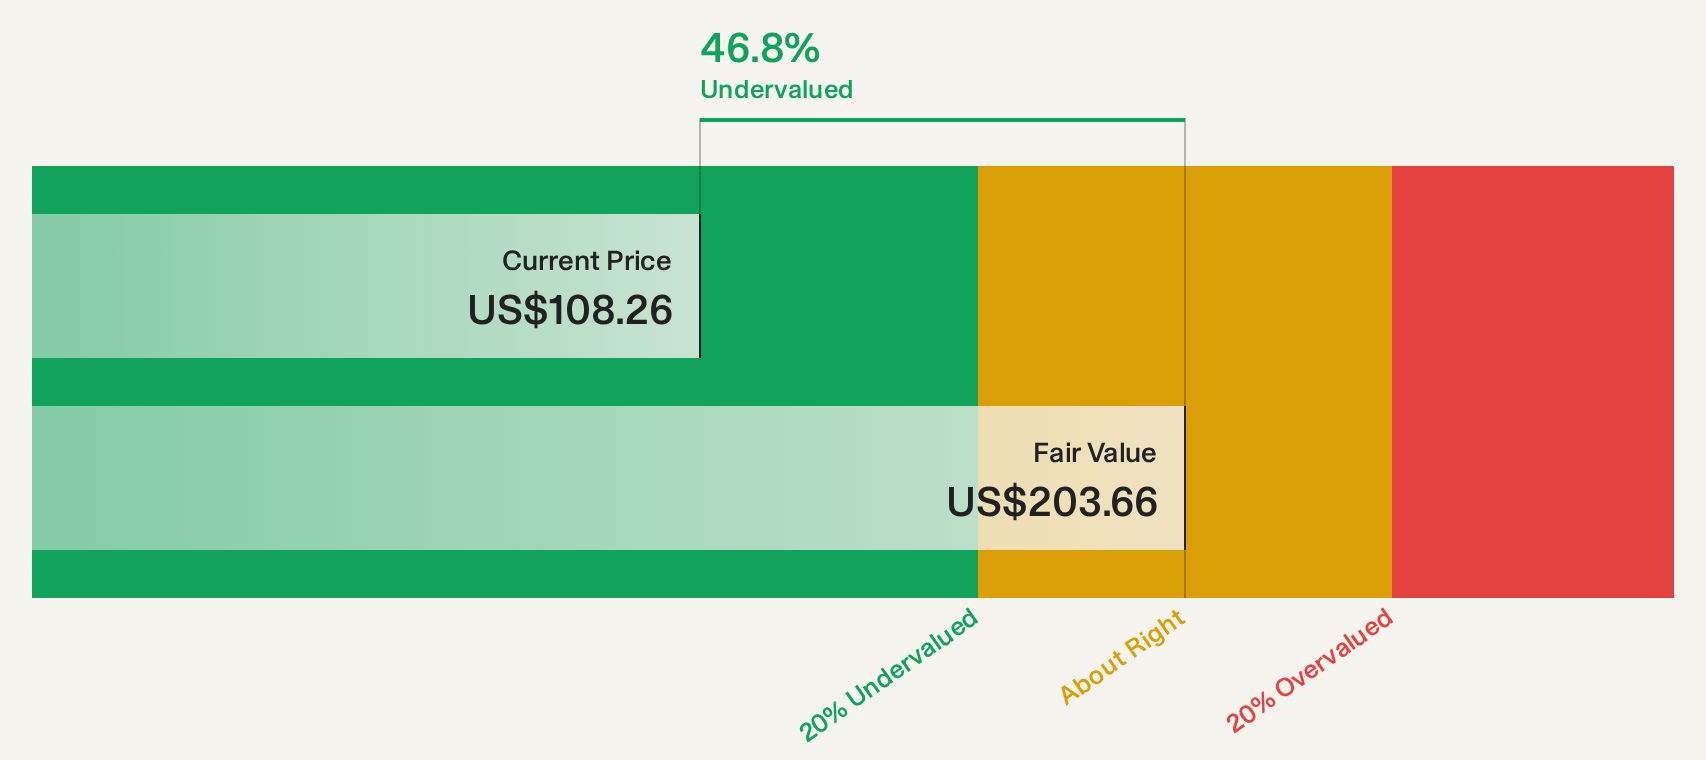
Estimated Discount To Fair Value: 46.9%
Crown Holdings is trading at US$107.69, significantly below its estimated future cash flow value of US$202.72, reflecting potential undervaluation based on cash flows. Despite high debt levels and slower forecasted earnings growth of 5.8% per year compared to the broader market, recent expansions such as a new facility in India highlight strategic moves into high-growth markets. Analysts agree on a potential 25.3% stock price increase, supported by robust financial performance and share buybacks totaling over $1 billion since 2024.
- The analysis detailed in our Crown Holdings growth report hints at robust future financial performance.
- Click here and access our complete balance sheet health report to understand the dynamics of Crown Holdings.
M&T Bank (MTB)
Overview: M&T Bank Corporation is a bank holding company for Manufacturers and Traders Trust Company and Wilmington Trust, National Association, offering retail and commercial banking products and services in the United States, with a market cap of approximately $31.52 billion.
Operations: The company's revenue segments include $2.76 billion from the Commercial Bank, $4.53 billion from the Retail Bank, and $1.55 billion from Institutional Services and Wealth Management.
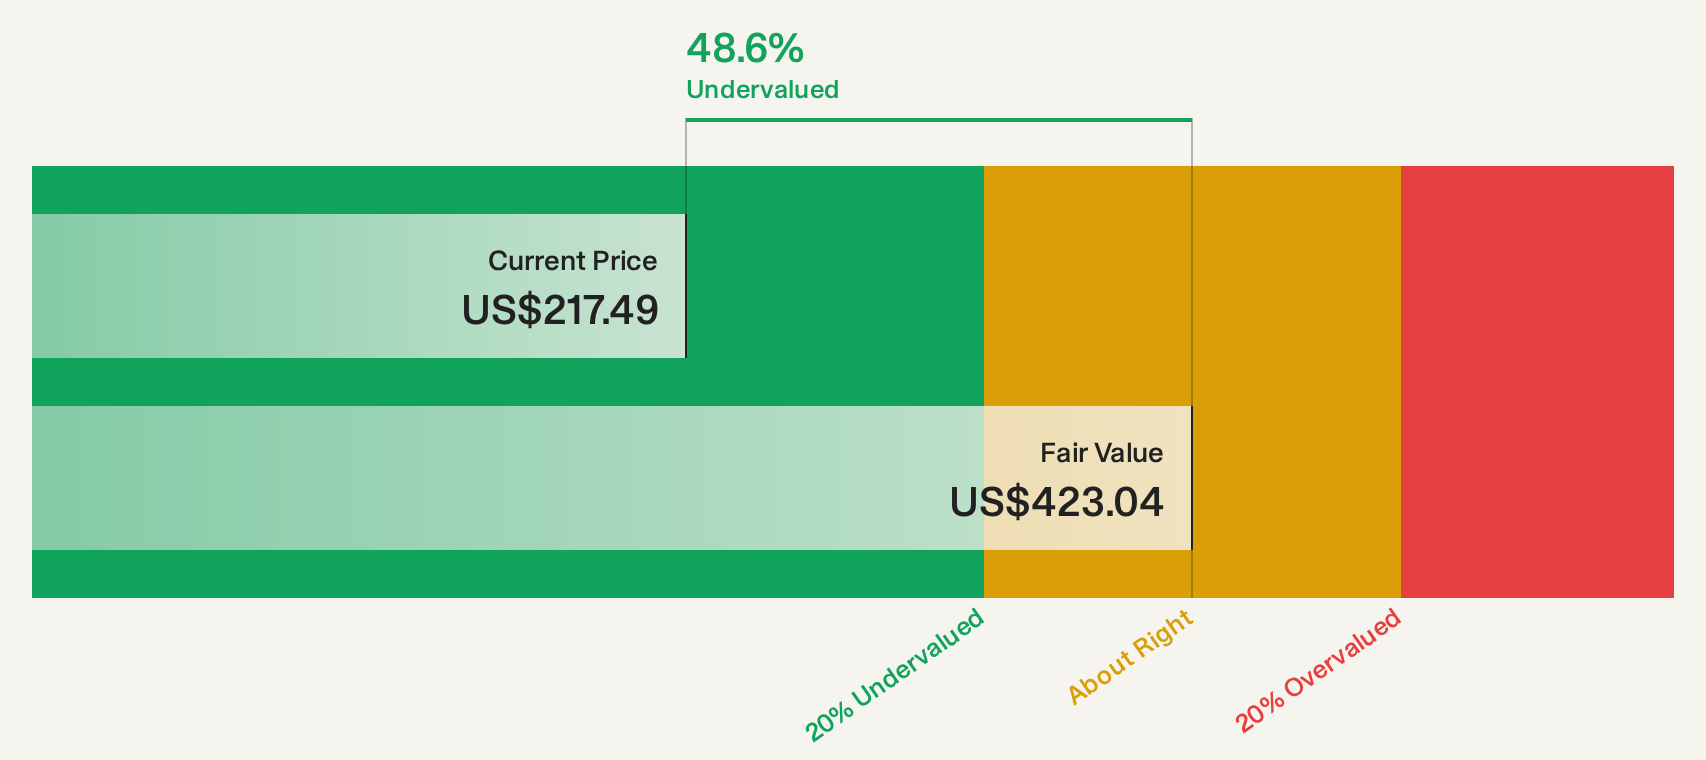
Estimated Discount To Fair Value: 47.6%
M&T Bank is trading at US$218.74, significantly below its estimated future cash flow value of US$417.56, indicating potential undervaluation based on cash flows. The bank's earnings and revenue growth forecasts lag behind the broader market, with 2.7% and 4.3% respectively, but it maintains a reliable dividend yield of 2.74%. Recent expansions like the new branch in Connecticut underscore M&T's commitment to community investment despite slower growth prospects compared to peers.
- According our earnings growth report, there's an indication that M&T Bank might be ready to expand.
- Navigate through the intricacies of M&T Bank with our comprehensive financial health report here.
Key Takeaways
- Click through to start exploring the rest of the 100 Undervalued US Stocks Based On Cash Flows now.
- Already own these companies? Bring clarity to your investment decisions by linking up your portfolio with Simply Wall St, where you can monitor all the vital signs of your stocks effortlessly.
- Take control of your financial future using Simply Wall St, offering free, in-depth knowledge of international markets to every investor.
Interested In Other Possibilities?
- Explore high-performing small cap companies that haven't yet garnered significant analyst attention.
- Diversify your portfolio with solid dividend payers offering reliable income streams to weather potential market turbulence.
- Fuel your portfolio with companies showing strong growth potential, backed by optimistic outlooks both from analysts and management.
This article by Simply Wall St is general in nature. We provide commentary based on historical data and analyst forecasts only using an unbiased methodology and our articles are not intended to be financial advice. It does not constitute a recommendation to buy or sell any stock, and does not take account of your objectives, or your financial situation. We aim to bring you long-term focused analysis driven by fundamental data. Note that our analysis may not factor in the latest price-sensitive company announcements or qualitative material. Simply Wall St has no position in any stocks mentioned.
Have feedback on this article? Concerned about the content? Get in touch with us directly. Alternatively, email editorial-team@simplywallst.com