
SSY Group (SEHK:2005) Looks Fairly Valued After Boardroom Change
SSY Group (SEHK:2005) has refreshed its leadership, with the board appointing long serving subsidiary executive Mr. Wu Hengyao as an executive Director, and accepting the resignation of Mr. Su Xuejun.
Recent trading has been mixed for SSY Group, with the share price slipping 3.01% over the past week but advancing 19.13% over the last 90 days. The year-to-date share price return is down 4.20% and the 3-year total shareholder return has fallen 30.35%, suggesting short-term momentum has picked up even as longer-term holders have seen weaker outcomes.
Spot shifting leadership stories like SSY Group's and compare them with other hand picked healthcare and pharma opportunities using our 126 healthcare AI stocks.SSY Group is posting solid revenue and net income growth, yet the share price is still down over the year and over three years. Is this now a strong business offered at a fair valuation, or not?
Preferred P/E of 15.6x for SSY Group: Is it justified?
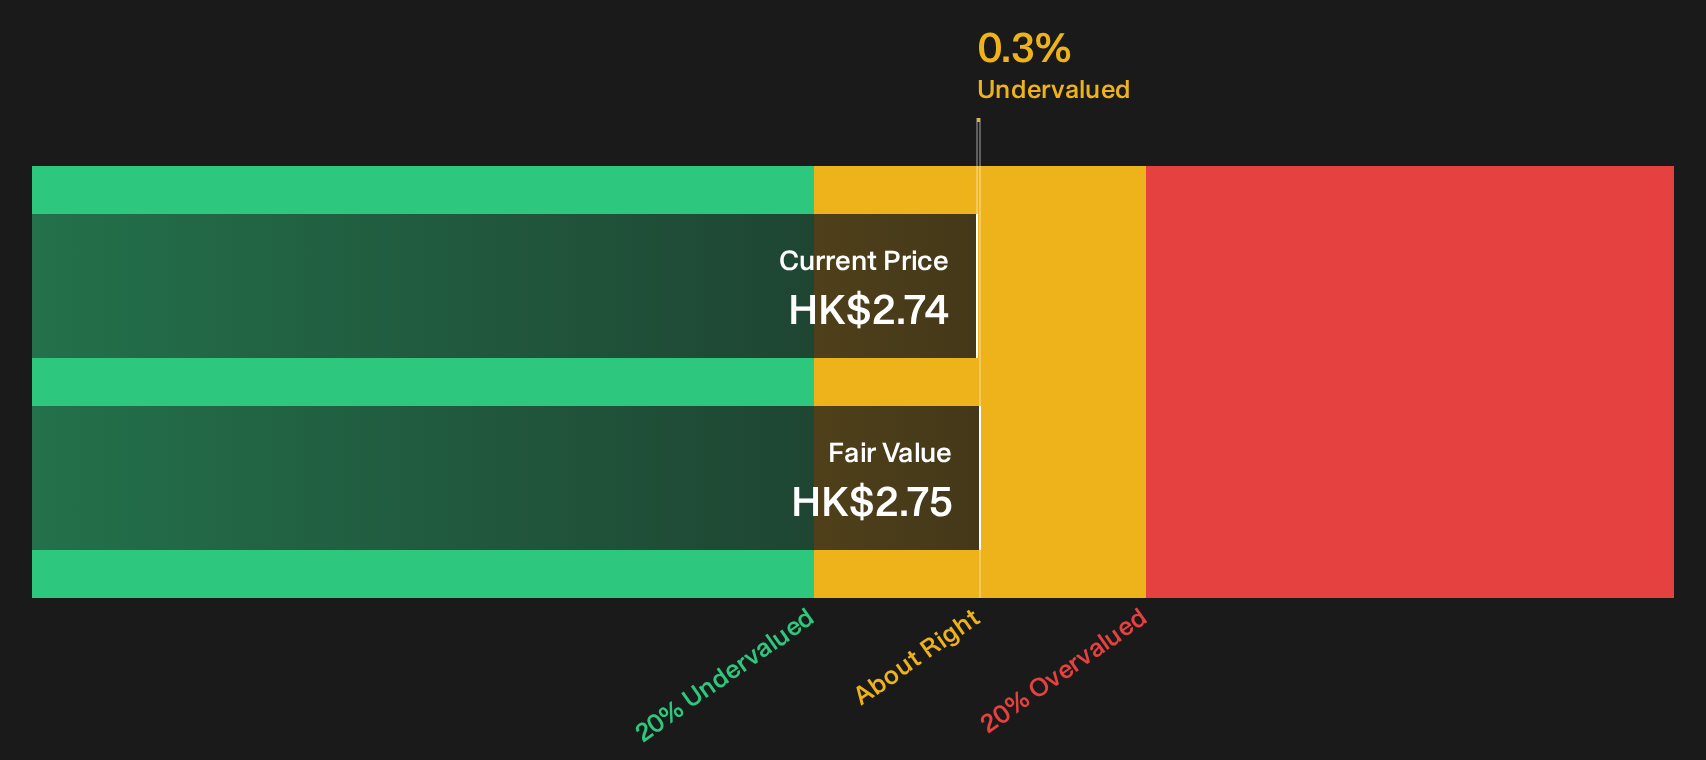
On Simply Wall St's fair value estimate, SSY Group is trading about in line with intrinsic value, with the stock at HK$2.74 versus an SWS DCF value of roughly HK$2.75, while the headline P/E ratio of 15.6x screens as expensive against both sector peers and the wider peer set.
The P/E multiple compares the current share price with earnings per share and is a common way investors gauge how much they are paying for each unit of profit. For a pharmaceutical manufacturer like SSY Group, that figure often reflects expectations for future earnings trends, the quality of cash flows and perceived risk in funding and governance.
Here, the market is paying 15.6x earnings. That is higher than the Hong Kong Pharmaceuticals industry average of 13.9x and also above the peer group average of 10.9x, which points to investors assigning a premium rather than a discount. At the same time, Simply Wall St's fair P/E estimate sits at 16.3x, which is slightly above the current multiple and indicates that the market valuation is close to that level under current conditions and forecasts.
Explore the SWS fair ratio for SSY Group.
Result: Price-to-earnings of 15.6x (ABOUT RIGHT)
Still, the narrative around SSY Group can change quickly if healthcare pricing policies tighten or if overseas revenue from Other Countries, now HK$787.1m, loses momentum.
Find out about the key risks to this SSY Group narrative.
Another view on SSY Group's value
The SWS DCF model also suggests SSY Group is roughly fairly priced, with the share price at HK$2.74 and the model value at HK$2.75. That tiny gap can cut both ways. Are you comfortable relying on a model that leaves so little margin for error?
Look into how the SWS DCF model arrives at its fair value.
Simply Wall St performs a discounted cash flow (DCF) on every stock in the world every day (check out SSY Group for example). We show the entire calculation in full. You can track the result in your watchlist or portfolio and be alerted when this changes, or use our stock screener to discover 181 high quality undervalued stocks. If you save a screener we even alert you when new companies match - so you never miss a potential opportunity.
Next Steps
Curious whether the cautious tone so far matches your own view on SSY Group? Take a closer look at the positives that investors are focusing on with the 2 key rewards
Looking for more ideas beyond SSY Group?
If SSY Group has sharpened your focus on valuation and quality, do not stop here. The right watchlist today can shape your outcomes tomorrow.
- Target higher quality at reasonable prices by scanning companies that pass strict fundamentals and valuation filters using our 181 high quality undervalued stocks.
- Strengthen your income stream by reviewing resilient payers with robust yields and balance sheets through the 166 dividend fortresses.
- Reduce portfolio stress by focusing on companies with steadier risk profiles using the 228 resilient stocks with low risk scores.
This article by Simply Wall St is general in nature. We provide commentary based on historical data and analyst forecasts only using an unbiased methodology and our articles are not intended to be financial advice. It does not constitute a recommendation to buy or sell any stock, and does not take account of your objectives, or your financial situation. We aim to bring you long-term focused analysis driven by fundamental data. Note that our analysis may not factor in the latest price-sensitive company announcements or qualitative material. Simply Wall St has no position in any stocks mentioned.
Have feedback on this article? Concerned about the content? Get in touch with us directly. Alternatively, email editorial-team@simplywallst.com