
Brookfield (TSX:BN) Stock Looks Pricey Based On Current Earnings
Brookfield has seen its share price move around over the past few years, and that raises a straightforward question for you as an investor. Is the current price grounded in what the business is actually earning today and is expected to earn over time?
- Brookfield has delivered a 85.4% gain over the past 3 years, which puts real pressure on the numbers to show that earnings can carry that kind of share price shift.
- The group positions itself as a manager of real asset investments across real estate, infrastructure, renewable power, private equity and credit. This can shape expectations for fee income, performance-based earnings and the timing of cash flows that support its valuation.
- There is a second opinion on Brookfield worth weighing. See what analysts think Brookfield's shares could be worth.
The issue now is whether Brookfield's recent share price around $52.98 is adequately supported by the earnings power investors currently see in the business.
If you want to compare Brookfield’s recent swings with other potential ideas, a focused screen of 7 high quality undervalued stocks can be a useful next stop in your research.
Does Brookfield Look Pricey on Earnings?
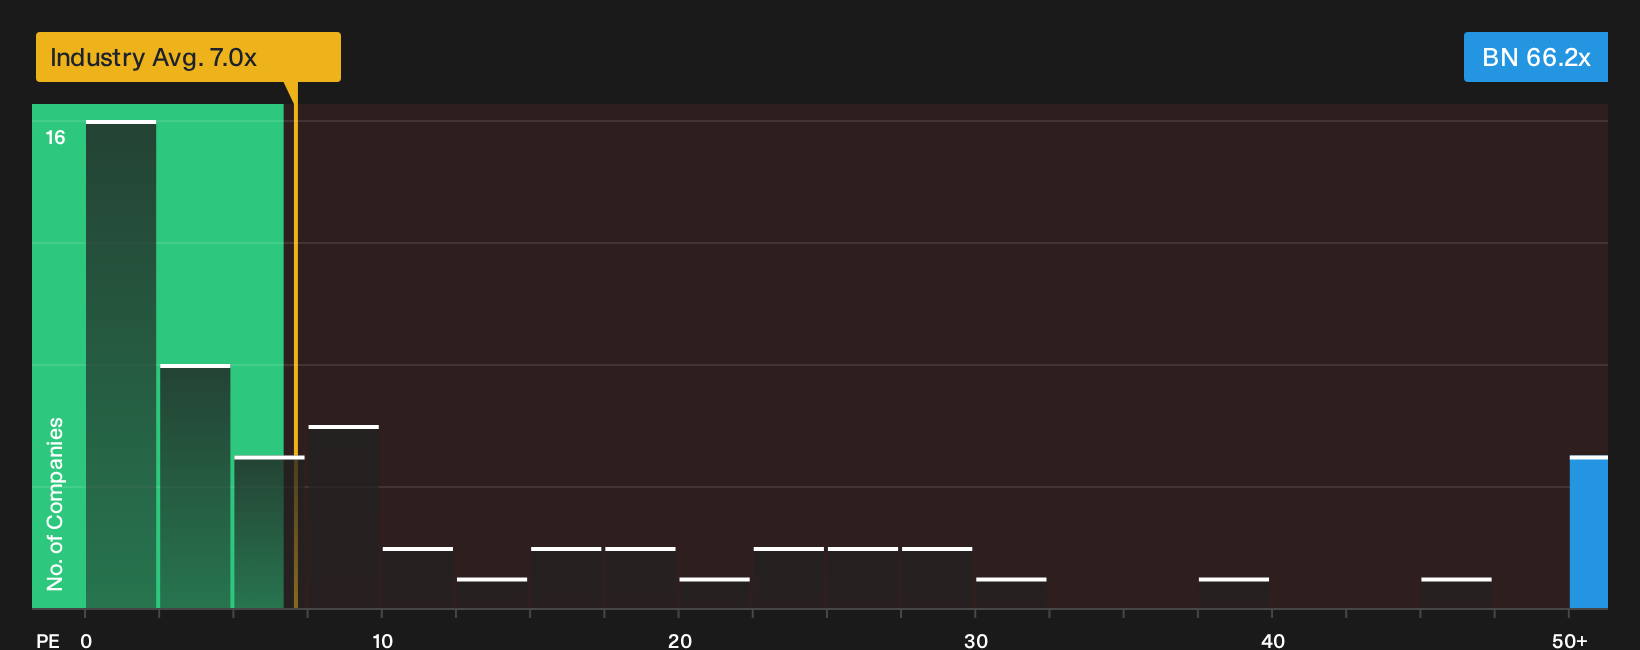
P/E is a natural lens for Brookfield because investors often anchor on the earnings stream that can support fees and capital allocation decisions. On this measure, Brookfield trades on about 66.2x earnings, which is far above the Capital Markets industry average near 7.0x and also well ahead of the peer group at roughly 16.5x. That kind of gap means buyers today are paying a much richer price for each dollar of reported profit than is typical for similar businesses.
Because Brookfield Asset Management focuses on real asset funds and private capital, some investors may argue its fee stability and potential performance income deserve a premium. The current P/E still screens as overvalued against the industry benchmark, and the excess returns model is heavily penalising recent earnings quality, so the high multiple looks more like a warning flag than a precise signal of how far off fair value might be. Despite the interest around Brookfield’s role in private equity and infrastructure funds, the valuation already bakes in a lot of optimism compared with sector norms. Explore the numbers behind Brookfield's P/E valuation.
The Brookfield Narrative: What Would Justify Today's Price?
Narratives for Brookfield pick up where the P/E puzzle leaves off by mapping out which future outcomes on growth, margins and earnings would need to hold for the stock to be worth materially more or materially less than today’s price on Simply Wall St’s Community page. Instead of a single ratio or model output, they set out the underlying storyline those numbers rely on so you can watch in real time whether Brookfield’s actual progress matches the path implied by the valuation.
A written, number-driven Narrative on Brookfield gives you a clear yardstick for whether the current valuation lines up with the fee and investment profile described in recent coverage. It turns broad stories about real assets and private equity into specific assumptions on earnings, cash generation and capital allocation that you can test as new results arrive.
Share your own Narrative for Brookfield and set out the assumptions behind your valuation.
One more Brookfield check that sits beside the P/E story
Price comparisons only tell you what Brookfield looks like today. The next step is to compare that picture with how professional analysts currently map out the next few years for this business. Explore where analysts expect Brookfield to be in a few years.
This article by Simply Wall St is general in nature. We provide commentary based on historical data and analyst forecasts only using an unbiased methodology and our articles are not intended to be financial advice. It does not constitute a recommendation to buy or sell any stock, and does not take account of your objectives, or your financial situation. We aim to bring you long-term focused analysis driven by fundamental data. Note that our analysis may not factor in the latest price-sensitive company announcements or qualitative material. Simply Wall St has no position in any stocks mentioned.
Have feedback on this article? Concerned about the content? Get in touch with us directly. Alternatively, email editorial-team@simplywallst.com