
Disco (TSE:6146) Sales Jumped, Is The Premium Already Priced In?
Disco (TSE:6146) is back in focus after reporting preliminary non consolidated sales of ¥118.5b for the September quarter and ¥213.6b for the first half, both above the prior year’s levels.
Recent trading reflects that attention. The share price has climbed to ¥65,500, with a 7 day share price return of 15.56% and a 30 day return of 20.27%. However, the 90 day share price return is down 4%, and the 5 year total shareholder return is very large, suggesting long term holders have already seen substantial gains while shorter term momentum has picked up again around Disco’s latest sales update.
Scan how Disco’s latest sales surprise compares with other potential breakouts across precision hardware and chip supply chains by reviewing the hand picked list of 90 robotics and automation stocks.
Bulls point to Disco’s sharp sales jump and the renewed share price momentum. Bears flag how far the stock has already run over five years. Which camp does the current valuation reward?
Price-to-Earnings of 48.7x: Is it justified?
On simple earnings math, Disco trades on a P/E of 48.7x, which already prices in a lot of future profit strength compared with many peers.
The P/E ratio compares the current share price to earnings per share and gives a quick read on how much investors are paying for each unit of profit. For a specialist in precision cutting and grinding equipment, where customers often operate on multi year investment cycles, this can reflect expectations for relatively steady demand and profitability.
Analysts expect Disco’s earnings to grow around 17.3% per year, ahead of the wider JP market’s 9.5% forecast, and Return on Equity is currently a high 25.1%. That kind of profitability profile can help explain why investors are willing to accept a richer multiple. However, the estimated fair P/E of 31x suggests the current level is materially higher than the valuation the market could move towards over time.
The comparison with peers is stark. Disco’s P/E of 48.7x sits just below a 51.3x peer average, but it is described as expensive versus the broader JP Semiconductor group at 23.4x and also expensive versus the 31x fair ratio estimate. Both of these points indicate a premium price tag on the shares.
Explore the SWS fair ratio for Disco.
Result: Price-to-Earnings of 48.7x (OVERVALUED)
Still, two things can quickly test this Disco story: any sharp pullback in chip capital spending and a reversal in the recent share price momentum.
Find out about the key risks to this Disco narrative.
Another View on Disco’s Valuation
The P/E discussion paints Disco as richly priced, but the SWS DCF model goes further. At ¥65,500, the stock sits well above an estimated future cash flow value of ¥25,087.64. That gap suggests little room for error if the cash generation story softens.
Investors who want to see how sensitive that estimate is to different assumptions can walk through the numbers in detail with the Look into how the SWS DCF model arrives at its fair value.
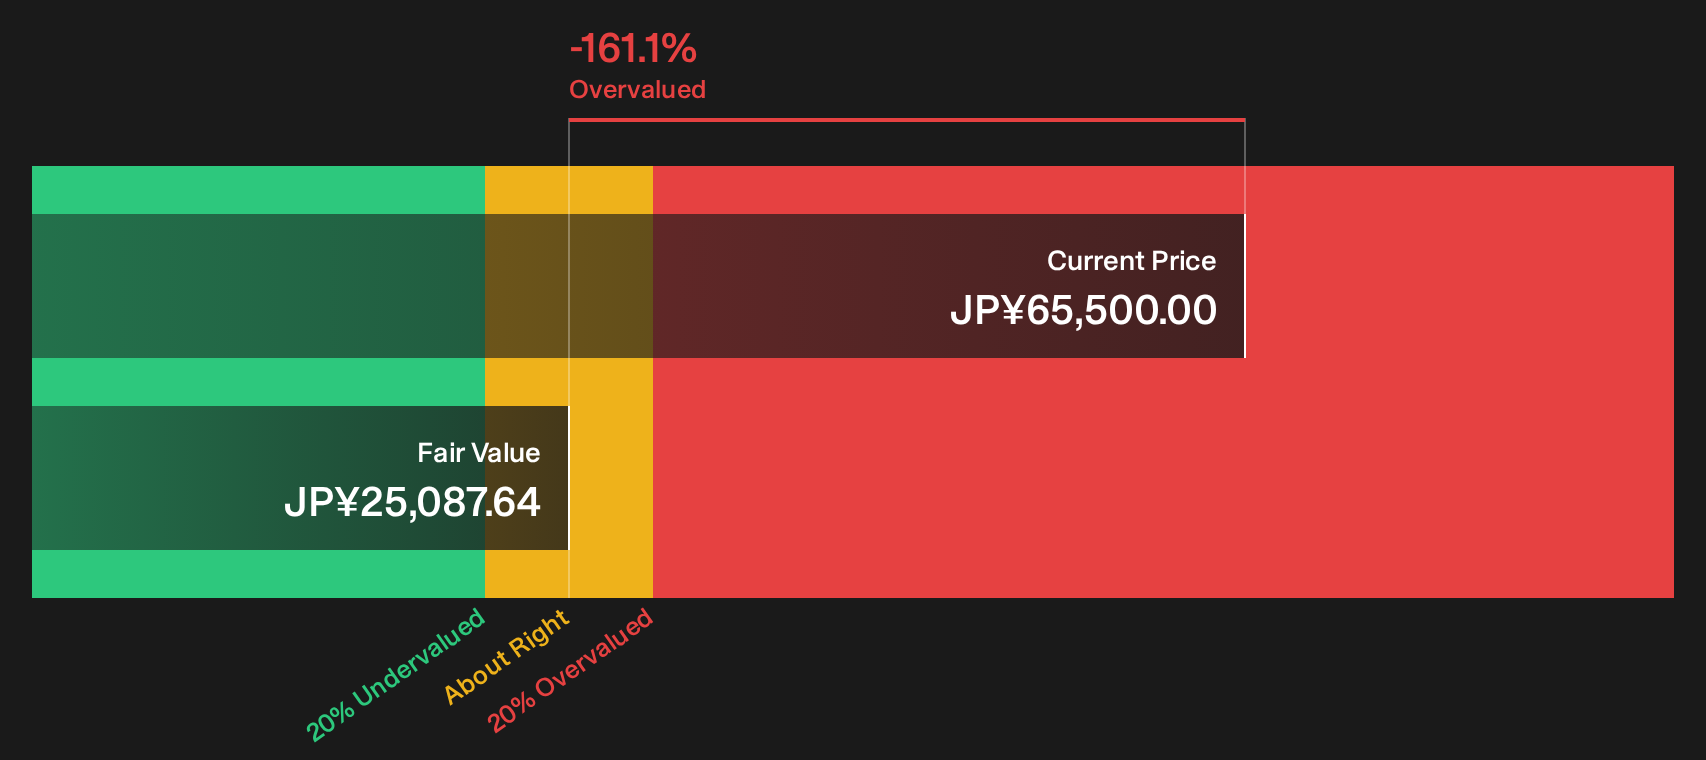
Simply Wall St performs a discounted cash flow (DCF) on every stock in the world every day (check out Disco for example). We show the entire calculation in full. You can track the result in your watchlist or portfolio and be alerted when this changes, or use our stock screener to discover 14 high quality undervalued stocks. If you save a screener we even alert you when new companies match - so you never miss a potential opportunity.
Next Steps
Sentiment around Disco is clearly split, with strong gains in the rear view and richer valuation tests on the table. Consider moving quickly, reviewing the numbers yourself, and stress testing both sides of the argument using the full breakdown of 2 key rewards and 1 important warning sign
Hunting For More Ideas Beyond Disco?
If Disco has you rethinking what you own, do not stop here. The next strong idea you add could matter far more than the last trade you made.
- Target resilient income by reviewing companies in the 21 dividend fortresses that focus on cash returns to shareholders through substantial ongoing payouts.
- Spot potential mispricing by scanning the 75 high quality undiscovered gems where solid fundamentals have yet to attract broad market attention.
- Prioritise capital protection first and returns second by filtering for the 22 resilient stocks with low risk scores that score well on financial strength and volatility.
This article by Simply Wall St is general in nature. We provide commentary based on historical data and analyst forecasts only using an unbiased methodology and our articles are not intended to be financial advice. It does not constitute a recommendation to buy or sell any stock, and does not take account of your objectives, or your financial situation. We aim to bring you long-term focused analysis driven by fundamental data. Note that our analysis may not factor in the latest price-sensitive company announcements or qualitative material. Simply Wall St has no position in any stocks mentioned.
Have feedback on this article? Concerned about the content? Get in touch with us directly. Alternatively, email editorial-team@simplywallst.com