
KDX Realty Investment (TSE:8972) Lifts Forecasts Following Portfolio Moves With Value Still In Focus
KDX Realty Investment (TSE:8972) has put investors on alert after lifting its earnings and distribution forecasts for the fiscal period ending April 2027, driven by recent property acquisitions and portfolio reshuffling.
Despite the upbeat forecast, KDX Realty Investment’s 1-year total shareholder return has declined 12.49%, while the share price has fallen 19.32% year to date to ¥141,600. This suggests weak momentum that recent acquisitions, green loan financing and shifting guidance have yet to fully reframe in investors’ eyes.
Scan how KDX Realty Investment compares with other income-focused plays by reviewing our hand picked 21 dividend fortresses with resilient payouts and higher yields.
The forecasts are moving up while KDX Realty Investment’s unit price has lagged, which leaves a wide gap between market scepticism and published fair value estimates. So where in that spread does a reasonable valuation anchor sit?
Preferred P/E of 16.8x for KDX Realty Investment: Is it justified?
KDX Realty Investment is currently on a P/E of 16.8x, which screens as inexpensive against its own fair P/E estimate of 19.8x and only slightly lower than the peer average of 17.7x.
The P/E ratio compares the current unit price to earnings per unit, so it effectively shows how much investors are paying today for each unit of current profit. For a J-REIT like KDX Realty Investment, where investors often focus on steady income streams and portfolio stability, this earnings based yardstick is a simple way to line up price against the underlying profit engine.
Two things jump out. First, the P/E of 16.8x is below the estimated fair P/E of 19.8x. This implies the market is assigning a lower earnings multiple than the level our fair ratio work suggests could be reasonable. Second, the current multiple is also framed as good value versus the peer average of 17.7x, even though it is described as expensive relative to the broader Asian REITs group on 15.4x. This signals that investors are paying a bit more than the wider regional sector but still less than what the fair ratio points to as a potential anchor.
Explore the SWS fair ratio for KDX Realty Investment.
Result: Price-to-earnings of 16.8x (UNDERVALUED).
Still, the sharp 19.32% year-to-date price decline and ongoing portfolio reshuffling after the 2023 merger could keep investors cautious on KDX Realty Investment.
Find out about the key risks to this KDX Realty Investment narrative.
Another view on KDX Realty Investment’s value
While the P/E work suggests KDX Realty Investment looks inexpensive, the SWS DCF model paints an even starker picture. At a unit price of ¥141,600 versus an estimated future cash flow value of ¥426,764.07, the units screen as heavily undervalued. That gap raises a simple question: is the market correctly pricing risk, or leaning too hard on recent weak momentum?
Look into how the SWS DCF model arrives at its fair value.
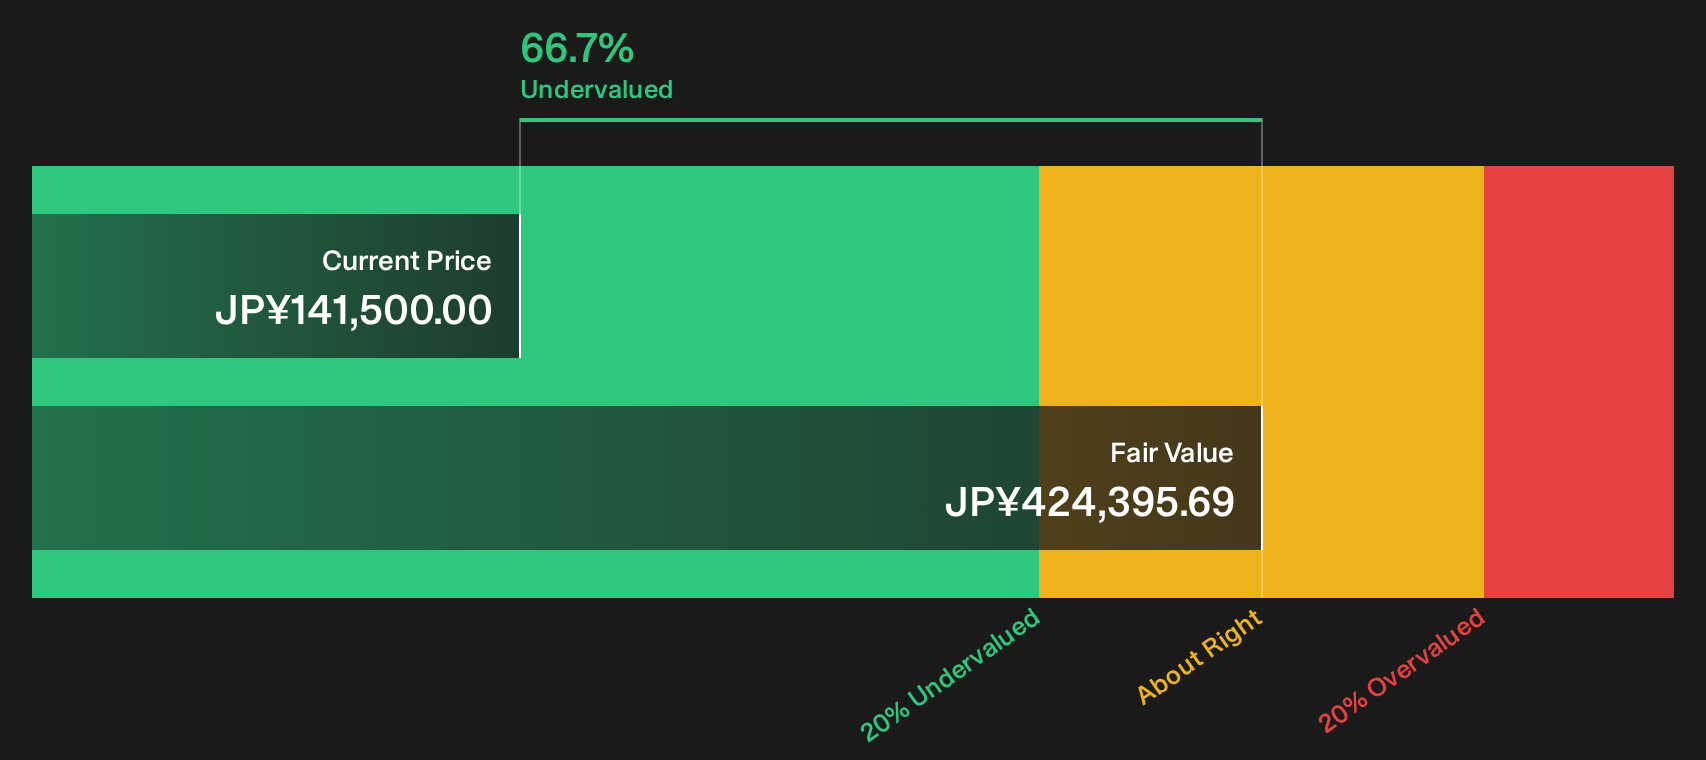
Simply Wall St performs a discounted cash flow (DCF) on every stock in the world every day (check out KDX Realty Investment for example). We show the entire calculation in full. You can track the result in your watchlist or portfolio and be alerted when this changes, or use our stock screener to discover 14 high quality undervalued stocks. If you save a screener we even alert you when new companies match - so you never miss a potential opportunity.
Next Steps
The combination of weak recent returns and positive valuation analysis presents a mixed picture for KDX Realty Investment, so treat this as your cue to move quickly, examine the data yourself, and weigh both the concerns and the bright spots, starting with the 5 key rewards and 1 important warning sign.
Looking for more investment ideas beyond KDX Realty Investment?
If KDX Realty Investment has your attention, do not stop here. Use the Simply Wall St screener to widen your opportunity set and pressure test your next move.
- Target resilient income by reviewing a curated set of higher yielding payers through the 21 dividend fortresses.
- Hunt for mispriced opportunities by scanning companies that combine quality fundamentals with attractive pricing in the 14 high quality undervalued stocks.
- Spot potential early movers by focusing on financially sound smaller stocks surfaced in the 1 elite penny stocks with strong financials.
This article by Simply Wall St is general in nature. We provide commentary based on historical data and analyst forecasts only using an unbiased methodology and our articles are not intended to be financial advice. It does not constitute a recommendation to buy or sell any stock, and does not take account of your objectives, or your financial situation. We aim to bring you long-term focused analysis driven by fundamental data. Note that our analysis may not factor in the latest price-sensitive company announcements or qualitative material. Simply Wall St has no position in any stocks mentioned.
Have feedback on this article? Concerned about the content? Get in touch with us directly. Alternatively, email editorial-team@simplywallst.com