
Spotlight On 3 Penny Stocks With Market Caps As Low As $10M
Over the last 7 days, the United States market has risen by 1.6%, and over the past year, it has climbed by 13%, with earnings forecasted to grow annually by 18%. While penny stocks might seem like a term from a bygone era, they continue to offer intriguing opportunities for investors seeking growth at lower price points. By focusing on smaller or newer companies with strong balance sheets and solid fundamentals, investors can potentially uncover hidden gems that align well with current market conditions.
Let's dive into some prime choices out of the screener.
Byrna Technologies (BYRN)
Simply Wall St Financial Health Rating: ★★★★☆☆
Overview: Byrna Technologies Inc. is a less-lethal self-defense technology company that develops, manufactures, and sells personal security solutions across various international markets, with a market cap of $78.97 million.
Operations: The company's revenue is derived from two main segments: $39.87 million from wholesale and $68.99 million from direct-to-consumer sales.
Market Cap: $78.97M
Byrna Technologies Inc., with a market cap of US$78.97 million, operates in the less-lethal self-defense technology sector. Despite being debt-free and having short-term assets of US$49.3 million that cover both its short and long-term liabilities, Byrna is currently unprofitable with a negative return on equity of -6.47%. Recent board changes include the appointment of Matthew McBrady, Ph.D., bringing significant experience from Axon Enterprise and GoBrands Inc., which could influence strategic direction positively. However, the company's management team is relatively new, averaging just 1.4 years in tenure, which may impact stability during this transition phase.
- Click here and access our complete financial health analysis report to understand the dynamics of Byrna Technologies.
- Assess Byrna Technologies' future earnings estimates with our detailed growth reports.
Myomo (MYO)
Simply Wall St Financial Health Rating: ★★★★★☆
Overview: Myomo, Inc. is a wearable medical robotics company that designs, develops, and produces myoelectric orthotics for individuals with neuromuscular disorders in the United States, Germany, and internationally; it has a market cap of $64.56 million.
Operations: Myomo generates revenue from its medical products segment, totaling $43.26 million.
Market Cap: $64.56M
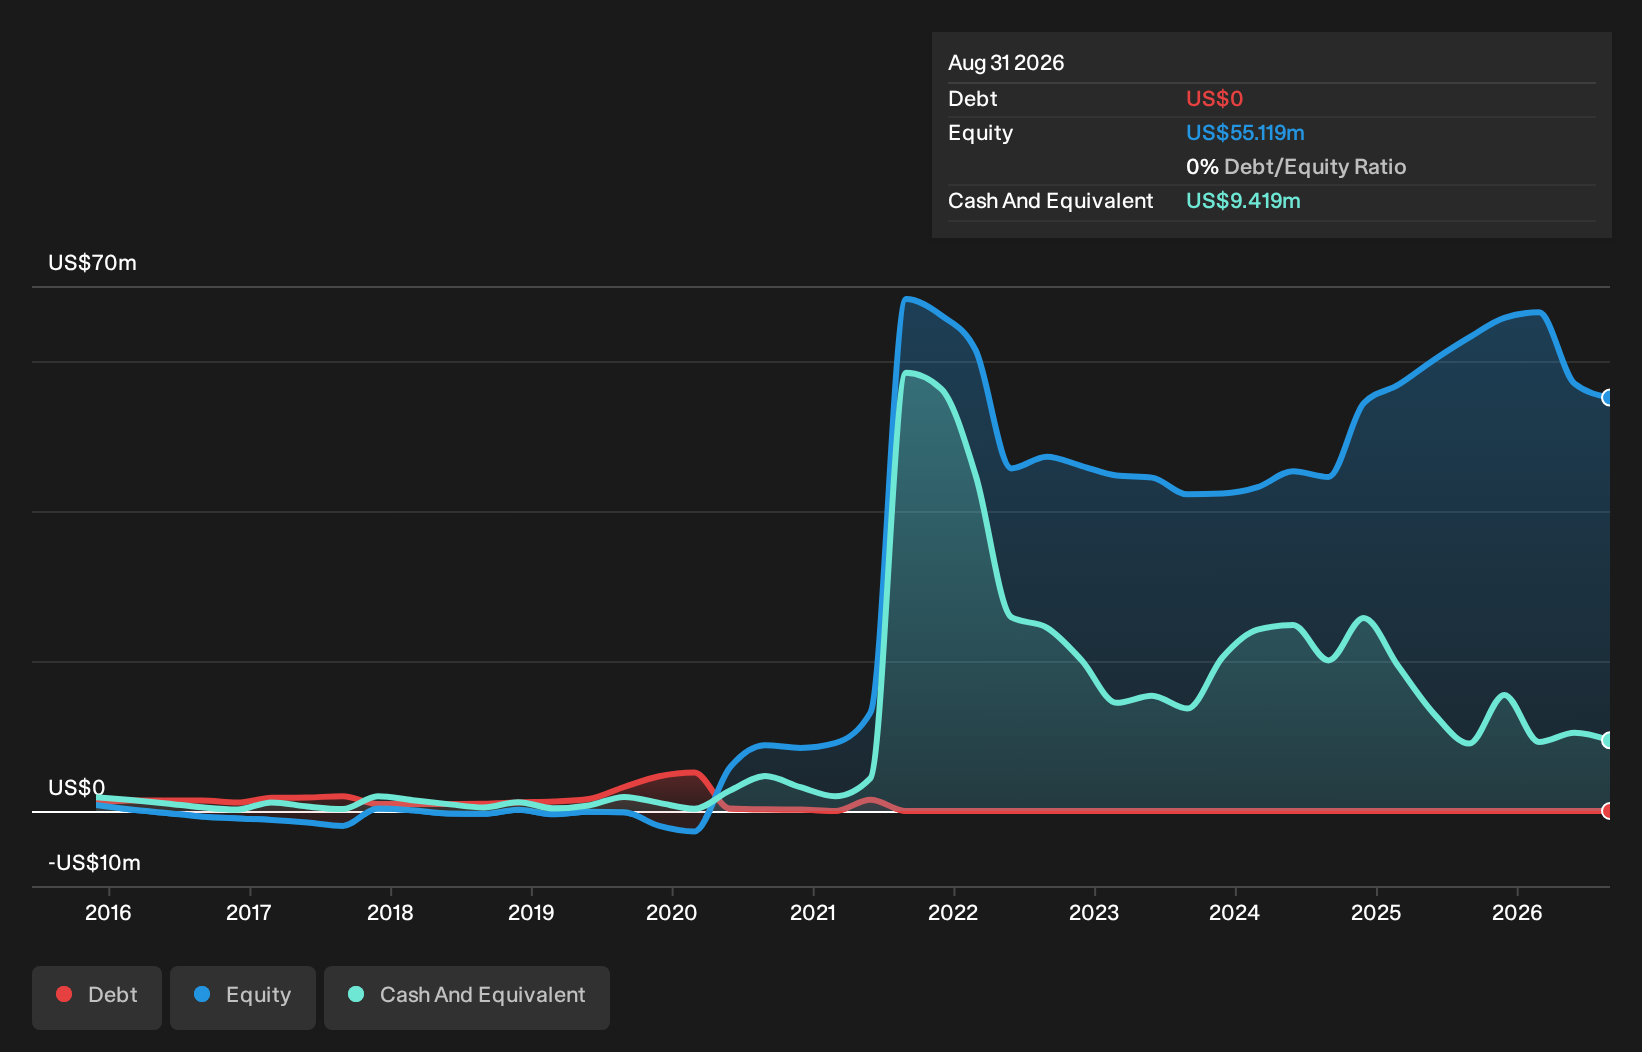
Myomo, Inc., with a market cap of US$64.56 million, is experiencing revenue growth, reporting US$11.7 million in Q2 2026 sales, up from US$9.65 million the previous year. Despite this growth and raising its full-year revenue guidance to between US$45 million and US$47 million, the company remains unprofitable with a net loss of US$4.02 million for the quarter. Its seasoned board has an average tenure of 13.3 years and management team averages 6.8 years in tenure; however, significant insider selling was noted recently. Myomo's short-term assets cover both short- and long-term liabilities effectively.
- Click here to discover the nuances of Myomo with our detailed analytical financial health report.
- Examine Myomo's earnings growth report to understand how analysts expect it to perform.
Kidoz (KDOZ.F)
Simply Wall St Financial Health Rating: ★★★★☆☆
Overview: Kidoz Inc. offers privacy-first contextual targeting advertising solutions across Canada, Europe, North America, and internationally, with a market cap of €13.67 million.
Operations: The company generates revenue of $19.55 million from its Ad Tech Advertising sales.
Market Cap: $13.67M
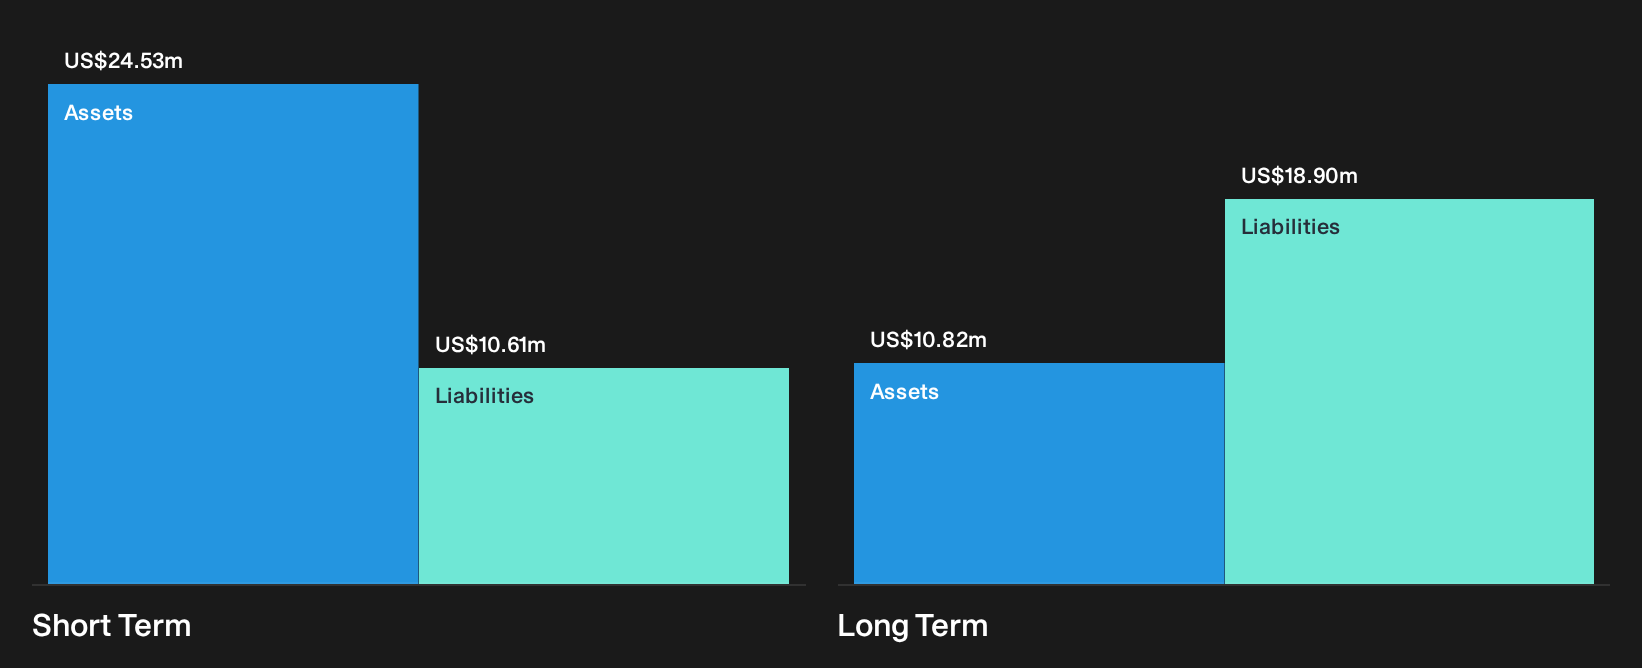
Kidoz Inc., with a market cap of €13.67 million, reported Q2 2026 sales of US$3.33 million, up from US$2.43 million the previous year, though it remains unprofitable with a net loss of US$1.56 million for the quarter. Despite its lack of profitability, Kidoz has no debt and reduced losses over five years by 16.2% annually. Its short-term assets cover liabilities comfortably at US$5.5M against US$2.6M in liabilities, and shareholders have not faced significant dilution recently; however, the share price has been highly volatile over three months.
- Dive into the specifics of Kidoz here with our thorough balance sheet health report.
- Explore Kidoz's analyst forecasts in our growth report.

Where To Now?
- Jump into our full catalog of 309 US Penny Stocks here.
- Searching for a Fresh Perspective? AI is about to change healthcare. These 127 stocks are working on everything from early diagnostics to drug discovery. The best part - they are all under $10b in market cap - there's still time to get in early.
This article by Simply Wall St is general in nature. We provide commentary based on historical data and analyst forecasts only using an unbiased methodology and our articles are not intended to be financial advice. It does not constitute a recommendation to buy or sell any stock, and does not take account of your objectives, or your financial situation. We aim to bring you long-term focused analysis driven by fundamental data. Note that our analysis may not factor in the latest price-sensitive company announcements or qualitative material. Simply Wall St has no position in any stocks mentioned.
Have feedback on this article? Concerned about the content? Get in touch with us directly. Alternatively, email editorial-team@simplywallst.com