
National Beverage (FIZZ) Slides On Softer Momentum, Does The Valuation Still Look Fair?
National Beverage (FIZZ) has drawn attention after a recent slide in its share price, with the stock down about 7% over the past month and roughly 8% in the past 3 months.
That recent slide comes on top of a softer year, with National Beverage’s share price down mid single digits year to date and the 1 year total shareholder return declining about 11%, which points to fading momentum as investors reassess both growth prospects and risk.
Scan beyond National Beverage and compare this pullback with a curated group of consumer-facing stocks on our 27 high quality undervalued stocks, which pair solid cash generation with balance sheets investors often look for in tougher periods.
Bulls see National Beverage’s pullback as a chance to own a profitable beverage group on more modest terms, while bears point to fading share-price momentum. Which side do the current valuation markers lean toward next?
Price-to-Earnings of 16x: Is it justified?
On simple valuation markers, National Beverage looks restrained, with the stock trading on a P/E of about 16x compared with a peer group sitting closer to 56.1x and a global beverage industry average of 16.6x.
The P/E ratio measures how much investors are paying today for each dollar of earnings, which matters a lot for a branded drinks group that already generates meaningful profit. For a business producing around $1.18b in annual revenue and $174.9m in net income, a mid-teens multiple means the market is attaching only a moderate price tag to those earnings.
High quality earnings and a very strong 47.6% return on equity suggest the market is not giving National Beverage a rich premium for profitability. Forecasts in hand point to earnings growth of about 4.6% per year. At the same time, revenue is expected to grow around 2.4% per year, slower than the broader US market. This can help explain why the P/E sits only slightly below the 16.6x industry average and above an estimated fair P/E of 14.1x that the market could gravitate toward over time.
Against both direct peers and that fair-value benchmark, the current 16x P/E looks conservative compared with the 56.1x peer average but still a little fuller than the 14.1x fair ratio estimate. This paints a mixed picture where the pullback has brought the share price closer to, but not clearly below, a purely earnings-based yardstick.
Explore the SWS fair ratio for National Beverage.
Result: Price-to-Earnings of 16x (ABOUT RIGHT)
Still, the story can change quickly if National Beverage sees slower demand for key brands like LaCroix or faces sharper price competition from larger rivals.
Find out about the key risks to this National Beverage narrative.
Another View: DCF Points To A Different Story
While the mid teens P/E suggests National Beverage is roughly in line with the broader beverage group, the SWS DCF model presents a different perspective. On that framework, FIZZ at $29.84 trades below an estimated future cash flow value of $35.95, which implies the market is leaving a meaningful gap on the table. Is that a margin of safety or a signal that cash flow expectations need to be reconsidered?
Look into how the SWS DCF model arrives at its fair value.
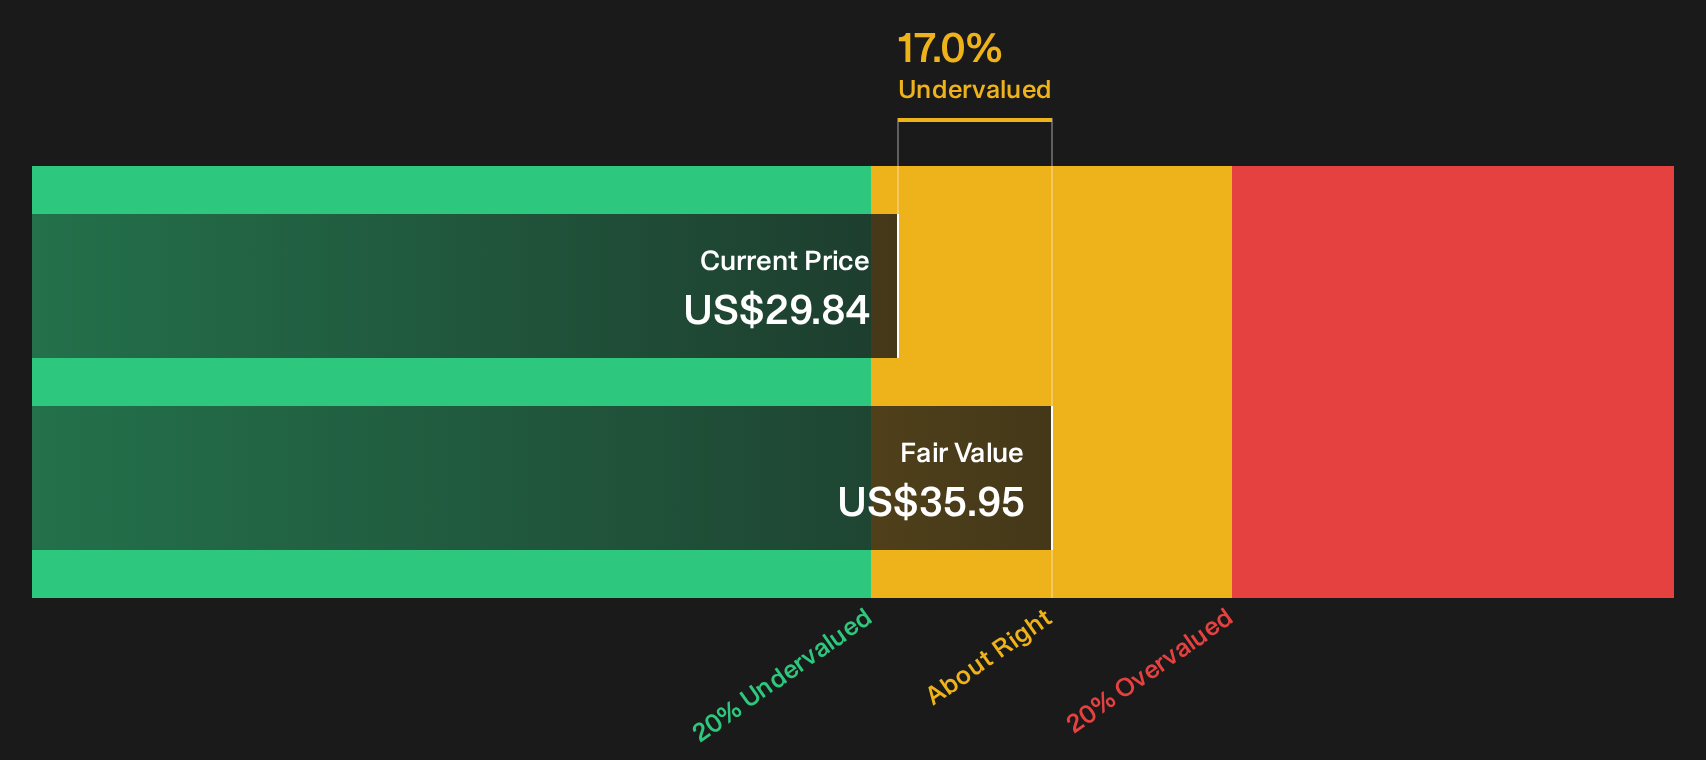
Simply Wall St performs a discounted cash flow (DCF) on every stock in the world every day (check out National Beverage for example). We show the entire calculation in full. You can track the result in your watchlist or portfolio and be alerted when this changes, or use our stock screener to discover 27 high quality undervalued stocks. If you save a screener we even alert you when new companies match - so you never miss a potential opportunity.
Next Steps
Sentiment around National Beverage is clearly split, which is exactly when doing your own work matters most. Move quickly, stress test the assumptions that matter to you, and then weigh them against the 2 key rewards.
Looking for more stock ideas beyond National Beverage?
If National Beverage has you reassessing your watchlist, use this pullback as a cue to refresh your broader opportunity set with targeted screeners.
- Hunt for potential mispricings by scanning companies that combine quality and value through our 27 high quality undervalued stocks.
- Strengthen your income pillar by reviewing businesses with higher yields that may interest dividend focused investors using the 7 dividend fortresses.
- Prioritise resilience by checking companies with robust finances through the list of solid balance sheet and fundamentals (25 results).
This article by Simply Wall St is general in nature. We provide commentary based on historical data and analyst forecasts only using an unbiased methodology and our articles are not intended to be financial advice. It does not constitute a recommendation to buy or sell any stock, and does not take account of your objectives, or your financial situation. We aim to bring you long-term focused analysis driven by fundamental data. Note that our analysis may not factor in the latest price-sensitive company announcements or qualitative material. Simply Wall St has no position in any stocks mentioned.
Have feedback on this article? Concerned about the content? Get in touch with us directly. Alternatively, email editorial-team@simplywallst.com