
Nordnet (OM:SAVE) Could Be 6% Undervalued On Fresh Operating Data And ETF Plans
Nordnet (OM:SAVE) has just put fresh numbers on the table. The broker reported September operating statistics and flagged progress on a new in house ETF range planned across its Nordic markets and Germany.
The recent operating update and ETF plans have landed against a mixed price pattern for Nordnet. The share price has gained 1.17% over the last day and 3.84% across the week, yet is down 2.75% over 30 days and 6.39% over 90 days. Year to date the share price return is 28.34% and the 5 year total shareholder return is 159.71%, indicating notable long term momentum alongside some shorter term cooling as investors reassess growth potential and risk around the new product push.
Scan beyond Nordnet and see how other brokers and platforms with strong customer and savings trends stack up using our curated list of 615 high quality undiscovered gems.
Given Nordnet’s strong customer figures and new ETF ambitions, set against a share price that has cooled in recent months, does it make more sense to commit capital now or wait for a cleaner entry on valuation grounds?
Most Popular Narrative: 6% Undervalued
Nordnet’s most followed valuation narrative points to a fair value of about SEK368 per share versus the last close at SEK346. This suggests the current pricing sits below that narrative estimate while still assuming measured growth and profitability.
The firm's proven operating leverage and disciplined cost control (revenue growth of 25% per year since 2019 outpacing 7% cost growth) support the potential for continued net margin and earnings improvement as its technology-driven business model scales across a growing pan-European customer base.
See why 10 investors see Nordnet as 6% undervalued.
Result: Fair Value of SEK368 (UNDERVALUED)
Still, if trading activity softens or fee pressure in the Nordics intensifies, the current Nordnet valuation story could become less comfortable.
Find out about the key risks to this Nordnet narrative.
Another View On Nordnet’s Valuation
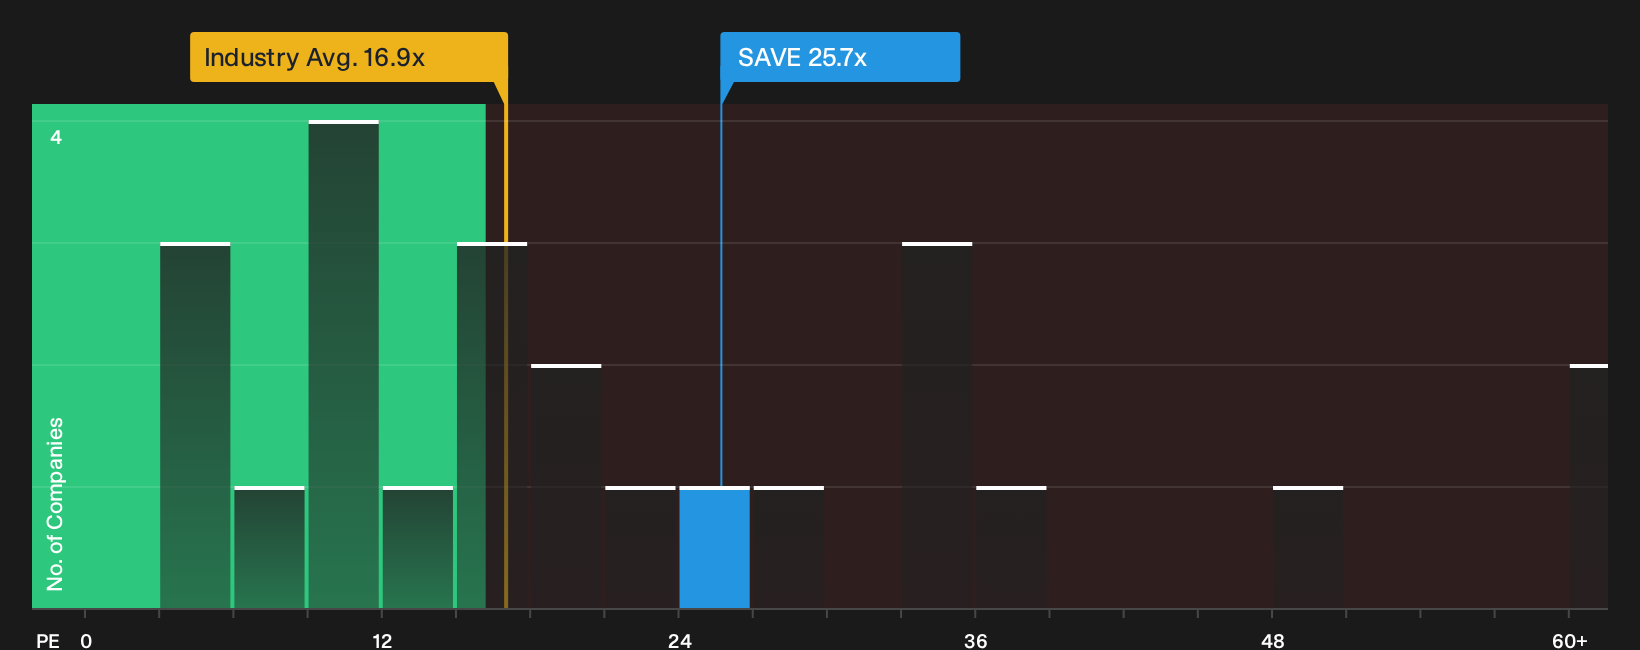
The story looks different once price is compared with earnings power. Nordnet trades on a P/E of 25.7x, while the Swedish Capital Markets group sits at 16.9x and the fair ratio is 16.8x. That gap implies investors are paying up. Is that premium comfort or risk if expectations cool?
To see how this pricing gap could close in either direction, including what a move toward the fair ratio might mean in practice, See what the numbers say about this price — find out in our valuation breakdown..
Next Steps
If this mix of optimism and concern around Nordnet feels familiar, take prompt action, review the data yourself, and weigh up the 2 key rewards and 2 important warning signs.
Looking For More Investment Ideas Beyond Nordnet?
You have fresh context on Nordnet. Do not stop there when other compelling setups are only a few clicks away on the Simply Wall Street Screener.
- Target resilient compounding potential by scanning companies that look undervalued on both quality and price using the 187 high quality undervalued stocks.
- Strengthen your downside protection and focus on capital preservation by reviewing a 226 resilient stocks with low risk scores that scores well on financial resilience.
- Hunt for future leaders before the crowd catches on by tracking our 615 high quality undiscovered gems with strong fundamentals and cleaner balance sheets.
This article by Simply Wall St is general in nature. We provide commentary based on historical data and analyst forecasts only using an unbiased methodology and our articles are not intended to be financial advice. It does not constitute a recommendation to buy or sell any stock, and does not take account of your objectives, or your financial situation. We aim to bring you long-term focused analysis driven by fundamental data. Note that our analysis may not factor in the latest price-sensitive company announcements or qualitative material. Simply Wall St has no position in any stocks mentioned.
Have feedback on this article? Concerned about the content? Get in touch with us directly. Alternatively, email editorial-team@simplywallst.com