
Fujikura (TSE:5803) Lands Fusion Supply Deal As Valuation Questions Grow
Why Fujikura’s Fusion Tape Deal Matters For Investors
Fujikura (TSE:5803) just signed a landmark agreement with Commonwealth Fusion Systems to supply more than 10,000 km of high-temperature superconducting tape for ARC fusion power plants.
The commitment includes expanded manufacturing capacity at Fujikura to deliver this material at scale, positioning the business within the industrial supply chain that supports commercial fusion projects in the U.S. and Japan.
The Commonwealth Fusion Systems agreement lands on top of a powerful run in Fujikura’s stock, with a 1-month share price return of 13.07% and a year-to-date share price return of 82.10%, while total shareholder return over five years is extremely high. This suggests momentum that investors are now weighing against execution risks in fusion and broader valuation questions.
Compare Fujikura’s fusion-driven momentum with other power grid suppliers by scanning our hand-picked 40 power grid technology and infrastructure stocks aligned with the same long-term electrification theme.
After Fujikura’s sharp run and fresh fusion deal, the real fork in the road is simple: pay up now for a fusion supply story already in motion, or wait and hope the valuation gives you another shot.
Preferred P/E of 44.9x for Fujikura: Is It Justified?
Fujikura now trades on a P/E of 44.9x, which is rich against many reference points. The question for you is whether the current earnings power and fusion story justify that kind of multiple.
The P/E ratio compares the ¥5,598 share price with the latest earnings per share and shows how many yen investors are willing to pay today for each yen of profit. For a manufacturer of telecoms, power systems, electronics and auto components with exposure to fusion infrastructure, a higher P/E can signal that the market is factoring in strong profitability and durable demand.
On the numbers provided, Fujikura is described as expensive on a 44.9x P/E compared with peer averages of 21.9x and the JP Electrical industry at 13.9x. Compared with an estimated fair P/E of 40x from the SWS fair ratio work, the current valuation also sits above the level that historical relationships suggest the market could move towards over time.
Explore the SWS fair ratio for Fujikura.
Result: Price-to-earnings of 44.9x (OVERVALUED)
Still, the fusion supply story around Fujikura could be knocked off course if project timelines slip, or if competition ramps up and squeezes future pricing power.
Find out about the key risks to this Fujikura narrative.
Another View On Fujikura’s Valuation
The SWS DCF model paints a much harsher picture than the 44.9x P/E. On this framework, Fujikura at ¥5,598 trades above an estimated future cash flow value of ¥3,472.11, which screens as overvalued. It leaves a simple question: Are you paying too much for growth that is already in the price?
Look into how the SWS DCF model arrives at its fair value.
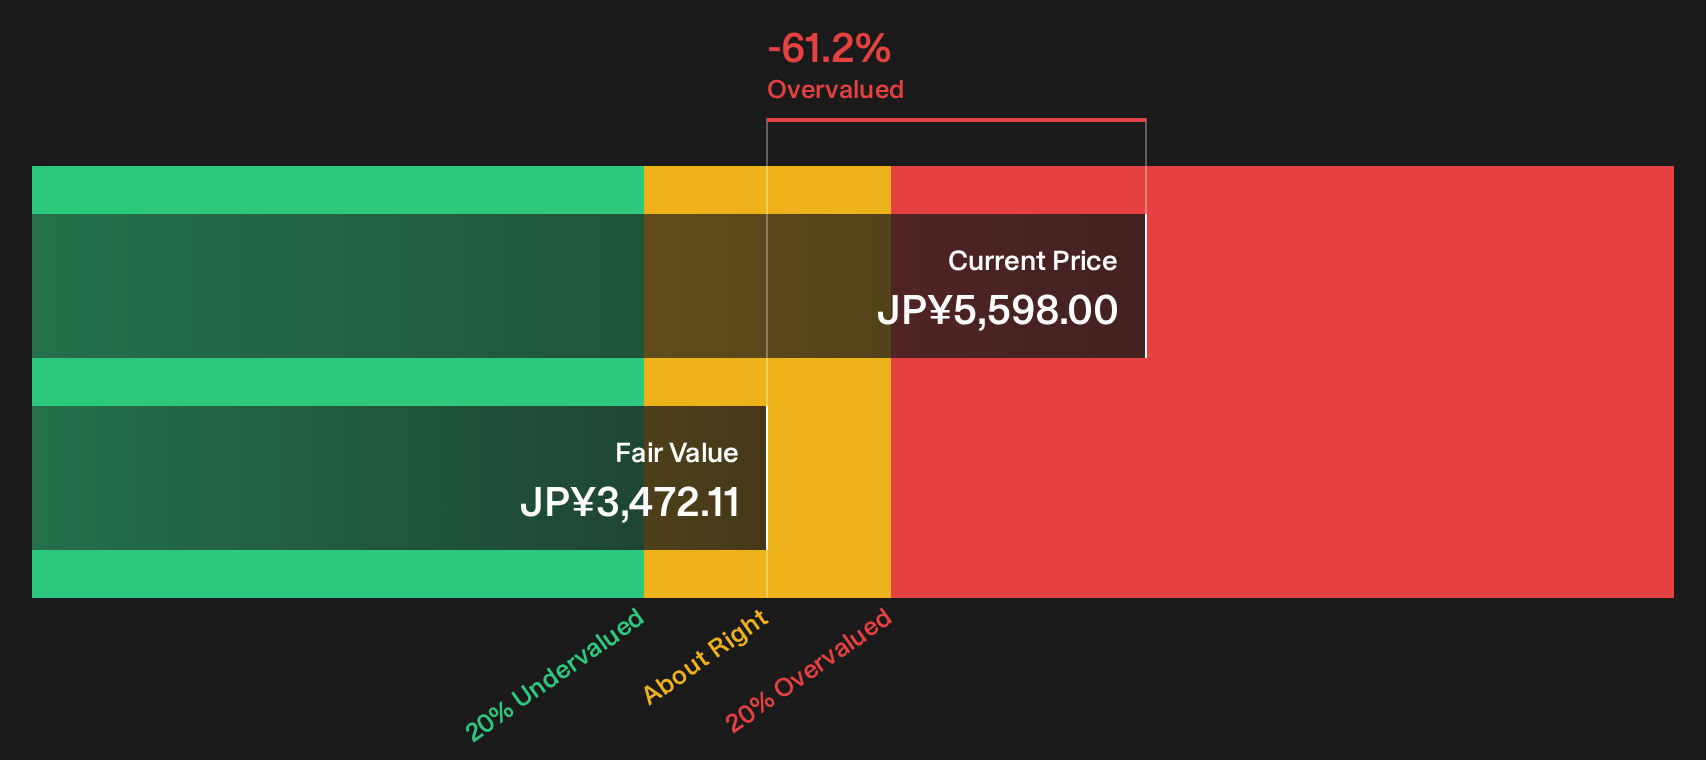
Simply Wall St performs a discounted cash flow (DCF) on every stock in the world every day (check out Fujikura for example). We show the entire calculation in full. You can track the result in your watchlist or portfolio and be alerted when this changes, or use our stock screener to discover 17 high quality undervalued stocks. If you save a screener we even alert you when new companies match - so you never miss a potential opportunity.
Next Steps
Fusion optimism and valuation worries pulling in opposite directions for Fujikura. That tension is exactly why you should review the data yourself, weigh the trade off between those 2 key rewards and 1 important warning sign, and then decide whether the story fits your risk tolerance with the help of the 2 key rewards and 1 important warning sign
Looking for more investment ideas beyond Fujikura?
Fujikura might be front and center today, but your next strong idea could come from a very different corner of the market. Widen your search before the opportunities narrow.
- Target potential mispricings by scanning companies that combine quality fundamentals with discounted valuations through our 17 high quality undervalued stocks.
- Build a portfolio that leans on income strength by reviewing a curated set of high-yield payers via the 24 dividend fortresses.
- Prioritise resilience by filtering for businesses with sturdy finances and solid fundamentals using the list of solid balance sheet and fundamentals (23 results).
This article by Simply Wall St is general in nature. We provide commentary based on historical data and analyst forecasts only using an unbiased methodology and our articles are not intended to be financial advice. It does not constitute a recommendation to buy or sell any stock, and does not take account of your objectives, or your financial situation. We aim to bring you long-term focused analysis driven by fundamental data. Note that our analysis may not factor in the latest price-sensitive company announcements or qualitative material. Simply Wall St has no position in any stocks mentioned.
Have feedback on this article? Concerned about the content? Get in touch with us directly. Alternatively, email editorial-team@simplywallst.com