
Armstrong World Industries (AWI) Slides As Valuation Questions Grow
Armstrong World Industries (AWI) drew fresh attention after recent trading data showed the share price at $163.12, with returns mixed over the past month, the past three months, and the past year.
Recent share price action for Armstrong World Industries has been choppy, with the stock down 3.5% over the past month and the year to date share price return declining 17.1%. However, the 3 year total shareholder return is up 137.1%, which signals longer term momentum built over time despite recent cooling and shifting views on growth and risk.
Compare Armstrong World Industries' mixed share performance with a hand picked group of building and infrastructure peers through the list of solid balance sheet and fundamentals (26 results).
Armstrong World Industries now trades well below the average analyst target, yet the recent slide hints at rising caution. Is this a valuation gap, or a signal that the market’s concerns carry more weight?
Price-to-Earnings of 21.9x: Is it justified?
On simple earnings maths, Armstrong World Industries trades on a P/E of 21.9x, which leaves the recent $163.12 share price looking richer than some peers and in line with a business investors expect to keep generating solid profits.
P/E compares what you pay for each share of Armstrong World Industries with the earnings that share currently produces. For a ceiling and wall solutions manufacturer serving commercial construction and renovation, this metric helps you gauge how much the market is willing to pay today for those established cash flows.
Against direct peers, the picture is mixed. The P/E of 21.9x is lower than the hand picked peer average of 26.6x, which points to a discount relative to similar building and infrastructure stocks that investors may see as competing for the same capital.
Against the broader US Building industry though, the same 21.9x multiple comes across as expensive versus the 19.7x industry average. It also sits above the estimated fair P/E of 20.7x, a level that suggests the market could shift closer to that fair ratio if sentiment or growth expectations cool from here.
Explore the SWS fair ratio for Armstrong World Industries.
Result: Price-to-Earnings of 21.9x (OVERVALUED)
Still, the decline of 17.1% year to date and an intrinsic discount figure that screens as rich at current levels leave Armstrong World Industries exposed if sentiment weakens or commercial construction demand slows.
Find out about the key risks to this Armstrong World Industries narrative.
Another view on Armstrong World Industries using our DCF model
The P/E story for Armstrong World Industries suggests only modest overvaluation, yet the SWS DCF model paints a sharper picture. On that framework, AWI at $163.12 screens as expensive versus an estimated future cash flow value of $84.61. Which signal should carry more weight for you?
Look into how the SWS DCF model arrives at its fair value.
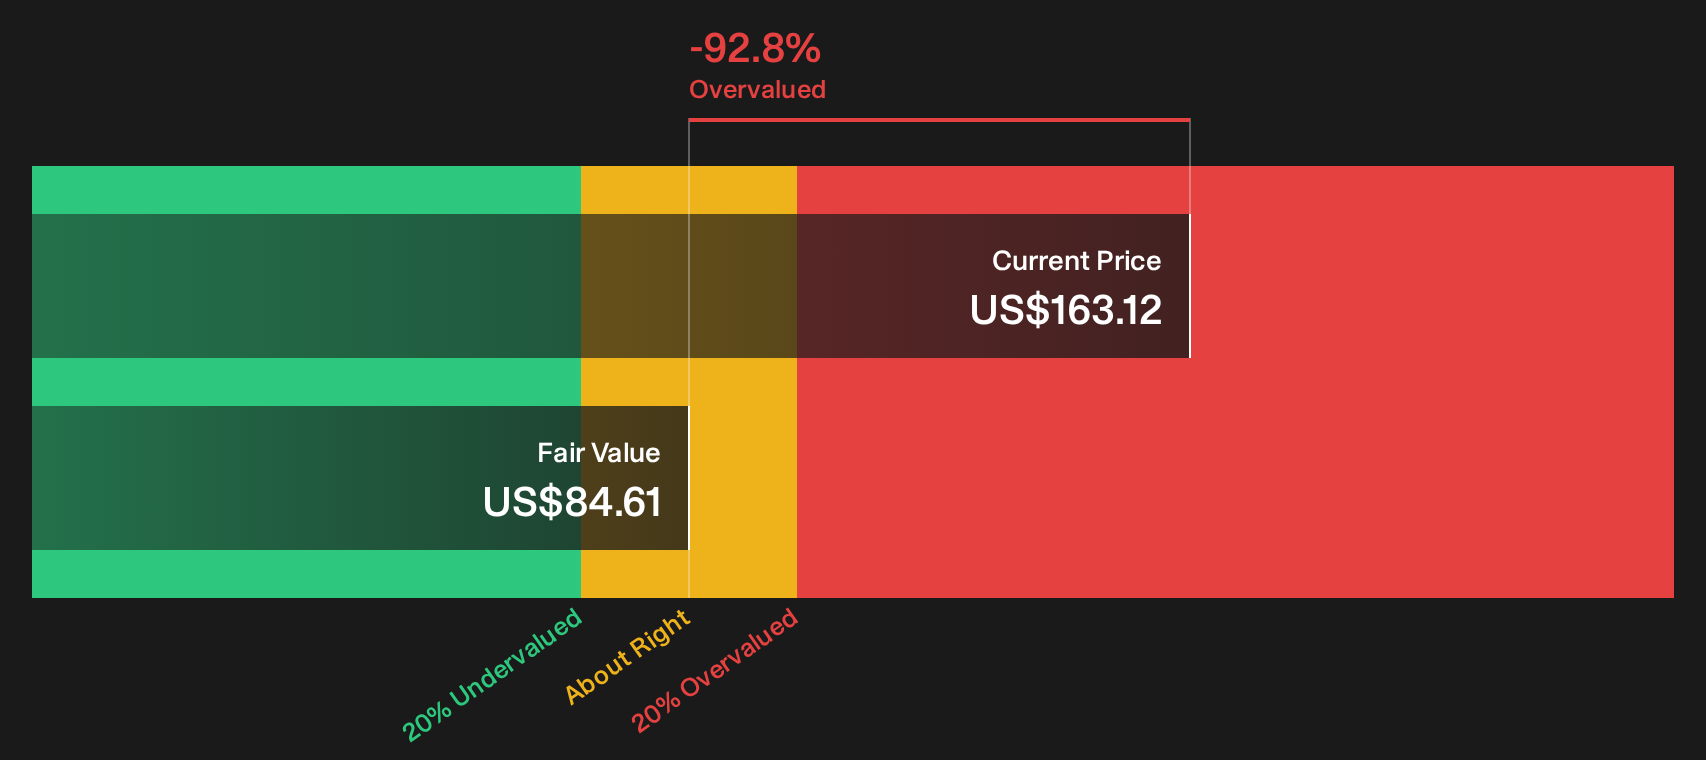
Simply Wall St performs a discounted cash flow (DCF) on every stock in the world every day (check out Armstrong World Industries for example). We show the entire calculation in full. You can track the result in your watchlist or portfolio and be alerted when this changes, or use our stock screener to discover 31 high quality undervalued stocks. If you save a screener we even alert you when new companies match - so you never miss a potential opportunity.
Next Steps
Mixed messages on Armstrong World Industries valuation and risk can be hard to read, so check the numbers yourself and decide whether today’s price lines up with your own expectations of growth, balance sheet strength and cash generation. To help frame both sides of the story in one place, review the 3 key rewards and 1 important warning sign
Looking for more Armstrong World Industries sized investment ideas?
If Armstrong World Industries has you thinking harder about price, quality and risk, broaden your watchlist now so you do not miss the next opportunity.
- Target resilience first by scanning a 31 resilient stocks with low risk scores that can help you focus on businesses where downside risk scores already look more controlled.
- Hunt for quality at a better entry point by reviewing a 31 high quality undervalued stocks that may show stronger fundamentals at less demanding prices.
- Build a steadier income stream by checking a 7 dividend fortresses that highlights higher yielding companies with a focus on stability.
This article by Simply Wall St is general in nature. We provide commentary based on historical data and analyst forecasts only using an unbiased methodology and our articles are not intended to be financial advice. It does not constitute a recommendation to buy or sell any stock, and does not take account of your objectives, or your financial situation. We aim to bring you long-term focused analysis driven by fundamental data. Note that our analysis may not factor in the latest price-sensitive company announcements or qualitative material. Simply Wall St has no position in any stocks mentioned.
Have feedback on this article? Concerned about the content? Get in touch with us directly. Alternatively, email editorial-team@simplywallst.com