
FuboTV (FUBO) Could Be 94% Undervalued On Its My Local Sports Launch
FuboTV (FUBO) is back in focus after launching My Local Sports, a new add on that lets subscribers in select markets pay for regional sports networks, layered onto the existing Fubo Sports plan.
My Local Sports lands at a time when momentum in FuboTV’s stock has been weak. The 30 day share price return is down 15.75% and the year to date share price return is down 71.43%, while the 1 year total shareholder return has declined 81.27%. This hints that recent product launches and new NHL regional rights are arriving against a backdrop of fading optimism and higher perceived risk.
Scan beyond FuboTV and size up other media players that our team has surfaced as 19 high quality undiscovered gems in the streaming and content space.
FuboTV trades at US$8.88 while analyst targets cluster near US$17 and intrinsic value estimates imply a similar gap. Is the recent slide an overreaction, or a warning that the market is pricing correctly?
Preferred Price-to-Sales of 0x for FuboTV: Is it justified?
On simple revenue-based math, FuboTV looks unusually cheap. The stock trades at a P/S ratio of 0x, compared with 0.9x for the US Interactive Media and Services industry and 1.4x for its peer group, while a fair P/S level for the business is estimated at 0.5x.
The P/S multiple compares the value the market assigns to a company with the sales it generates. For a subscription driven media platform like FuboTV, where earnings are still negative and profit based measures are less useful, investors often lean on revenue based gauges to judge how much they are paying for each dollar of top line.
FuboTV screens as good value across several angles. The current P/S ratio of 0x sits far below the estimated fair P/S of 0.5x, which indicates that the share price is well under the level the fair ratio suggests the market could move toward. Compared with the 0.9x industry average and the 1.4x peer group level, the discount is even more pronounced and points to the market assigning a much lower value to each dollar of FuboTV revenue than to comparable media platforms.
Explore the SWS fair ratio for FuboTV.
Result: Price-to-sales of 0x (UNDERVALUED)
Still, the long slide in FuboTV’s share price and the ongoing net loss of US$55.064m highlight execution risk if subscriber or content costs shift against the business.
Find out about the key risks to this FuboTV narrative.
Another View on FuboTV’s Value
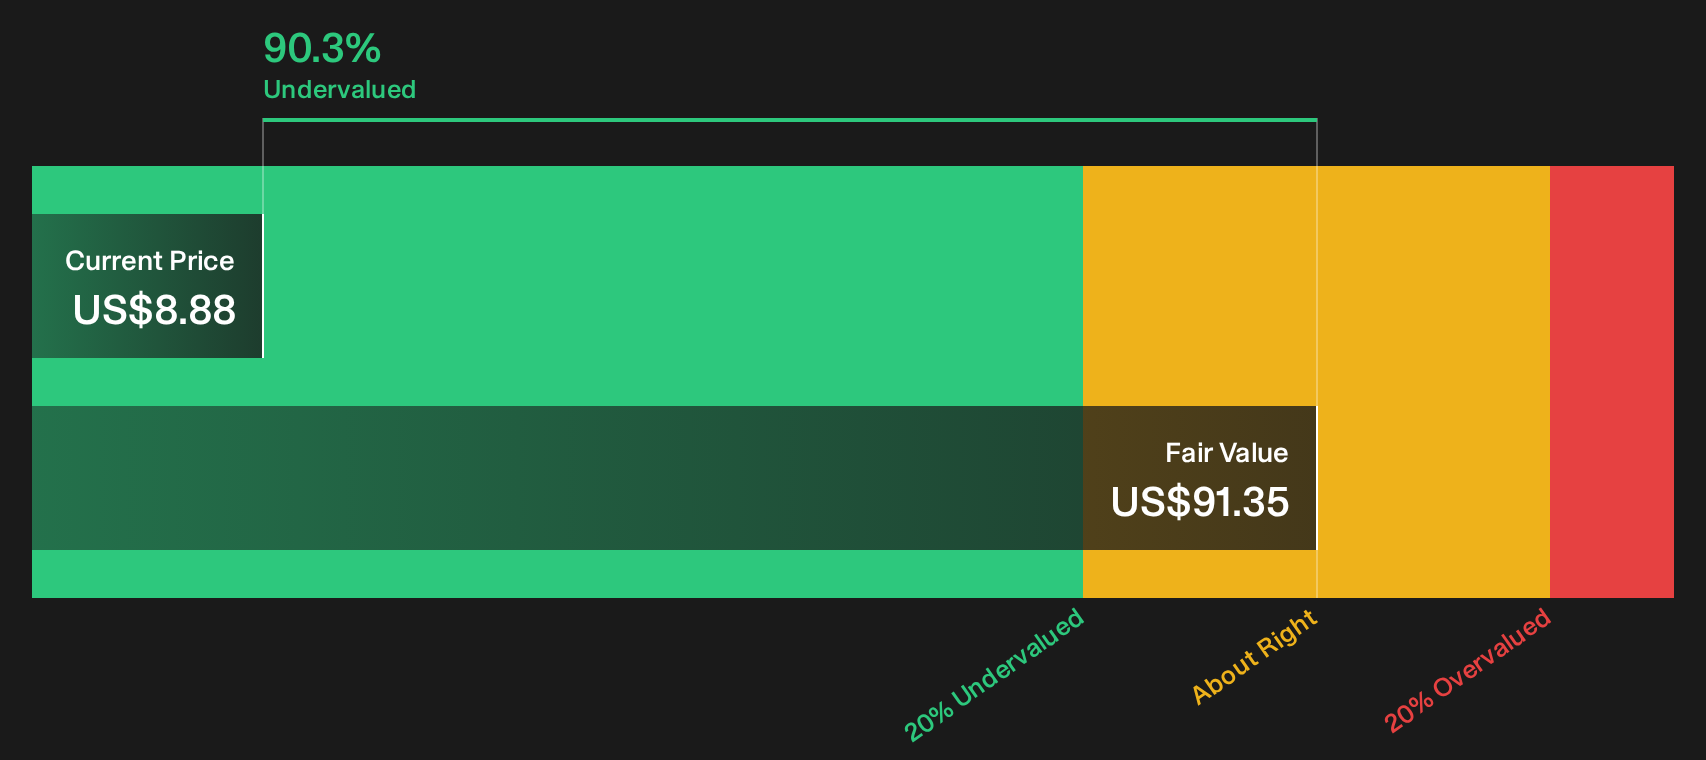
There is a very different read on FuboTV when switching from sales multiples to the SWS DCF model. That approach values future cash flows at about $91.35 per share, which is far above the current $8.88 price and indicates that the stock screens as deeply undervalued through this lens.
This kind of gap suggests either the market has serious doubts about FuboTV’s ability to turn forecasts into real cash, or the model is assigning too much value to long term growth and margin improvement. Which side of that debate an investor trusts will likely shape how they view the recent sell off.
Look into how the SWS DCF model arrives at its fair value.
Simply Wall St performs a discounted cash flow (DCF) on every stock in the world every day (check out FuboTV for example). We show the entire calculation in full. You can track the result in your watchlist or portfolio and be alerted when this changes, or use our stock screener to discover 28 high quality undervalued stocks. If you save a screener we even alert you when new companies match - so you never miss a potential opportunity.
Next Steps
Mixed signals around FuboTV can make the story feel messy, so move quickly, review the underlying numbers and sentiment, then weigh the 4 key rewards and 1 important warning sign.
Looking for more FuboTV investment ideas?
If FuboTV has you rethinking your watchlist, now is the moment to widen the lens and line up a few fresh contenders alongside it.
- Spot potential under-the-radar opportunities before the crowd by scanning our 19 high quality undiscovered gems that pair solid fundamentals with quieter market attention.
- Build a core watchlist around quality at a discount using the 28 high quality undervalued stocks that filters for strong businesses trading below implied worth.
- Stabilise your income stream by reviewing the 7 dividend fortresses that highlights higher yielding companies with a focus on resilience.
This article by Simply Wall St is general in nature. We provide commentary based on historical data and analyst forecasts only using an unbiased methodology and our articles are not intended to be financial advice. It does not constitute a recommendation to buy or sell any stock, and does not take account of your objectives, or your financial situation. We aim to bring you long-term focused analysis driven by fundamental data. Note that our analysis may not factor in the latest price-sensitive company announcements or qualitative material. Simply Wall St has no position in any stocks mentioned.
Have feedback on this article? Concerned about the content? Get in touch with us directly. Alternatively, email editorial-team@simplywallst.com