
DRDGOLD (DRD), Why Is Its Latest Update Drawing Fresh Attention?
DRDGOLD event puts dividends and expansion in focus
DRDGOLD (DRD) kept annual gold production at 155,000 ounces in fiscal 2026 while pushing ahead with its Vision 2028 expansion plan and paying a record dividend, its 19th straight year of shareholder payouts.
Recent trading tells a mixed story for DRDGOLD. The share price is down about 14% over the past month and roughly 20% year to date. However, the 3 year total shareholder return of about 226% and 5 year total shareholder return of about 231% point to momentum that has built over a longer horizon, with the recent pullback hinting at a shift in sentiment as investors weigh Vision 2028 spending against dividend income at a share price of US$24.25.
Scan beyond DRDGOLD and line up other producers with strong throughput potential using our curated list of 36 elite gold producer stocks to see how this stock compares on quality and momentum.
DRDGOLD has just paired record dividends with a sharp pullback in the share price. Is most of the big move already in the rearview mirror, or does the current valuation still leave meaningful upside on the table?
Price-to-Earnings of 8.1x: Is it justified?
On basic valuation, DRDGOLD trades on a P/E of 8.1x, which sits well below both the wider US market and its own industry peers at the current share price of $24.25.
The P/E ratio compares what investors are paying for each dollar of earnings. For a gold producer like DRDGOLD, this often reflects how confident the market is in the durability of profits that depend on both operational execution and commodity pricing.
DRDGOLD has paired that low P/E with earnings growth of 89.7% over the past year and a 5 year earnings growth rate of 27.6% per year. Return on equity of 33.4% and an improvement in net profit margins from 28.5% to 38.1% point to a business that has been converting revenue into profit efficiently, even though revenue itself is forecast to rise a more modest 8.2% per year.
Set against that earnings profile, the discount is sharp. The P/E of 8.1x sits far below the US Metals and Mining industry average of 20x and also undercuts the peer group average of 17.4x by a wide margin. That gap suggests the market is pricing DRDGOLD more cautiously than both the sector and its closest comparables despite its recent profit growth.
See what the numbers say about this price — find out in our valuation breakdown.
Result: Price-to-Earnings of 8.1x (UNDERVALUED).
Still, DRDGOLD faces clear pressure if Vision 2028 capital needs strain dividend flexibility, or if South African operating and power costs erode current profit margins.
Find out about the key risks to this DRDGOLD narrative.
Another view on DRDGOLD's value
The earnings multiple paints DRDGOLD as inexpensive, yet the SWS DCF model points the other way. At a share price of $24.25, the stock sits above an estimated future cash flow value of $16.59, which frames DRDGOLD as overvalued on this approach. Which signal carries more weight for you?
For readers who want to see how this gap is built up line by line in the model, Look into how the SWS DCF model arrives at its fair value.
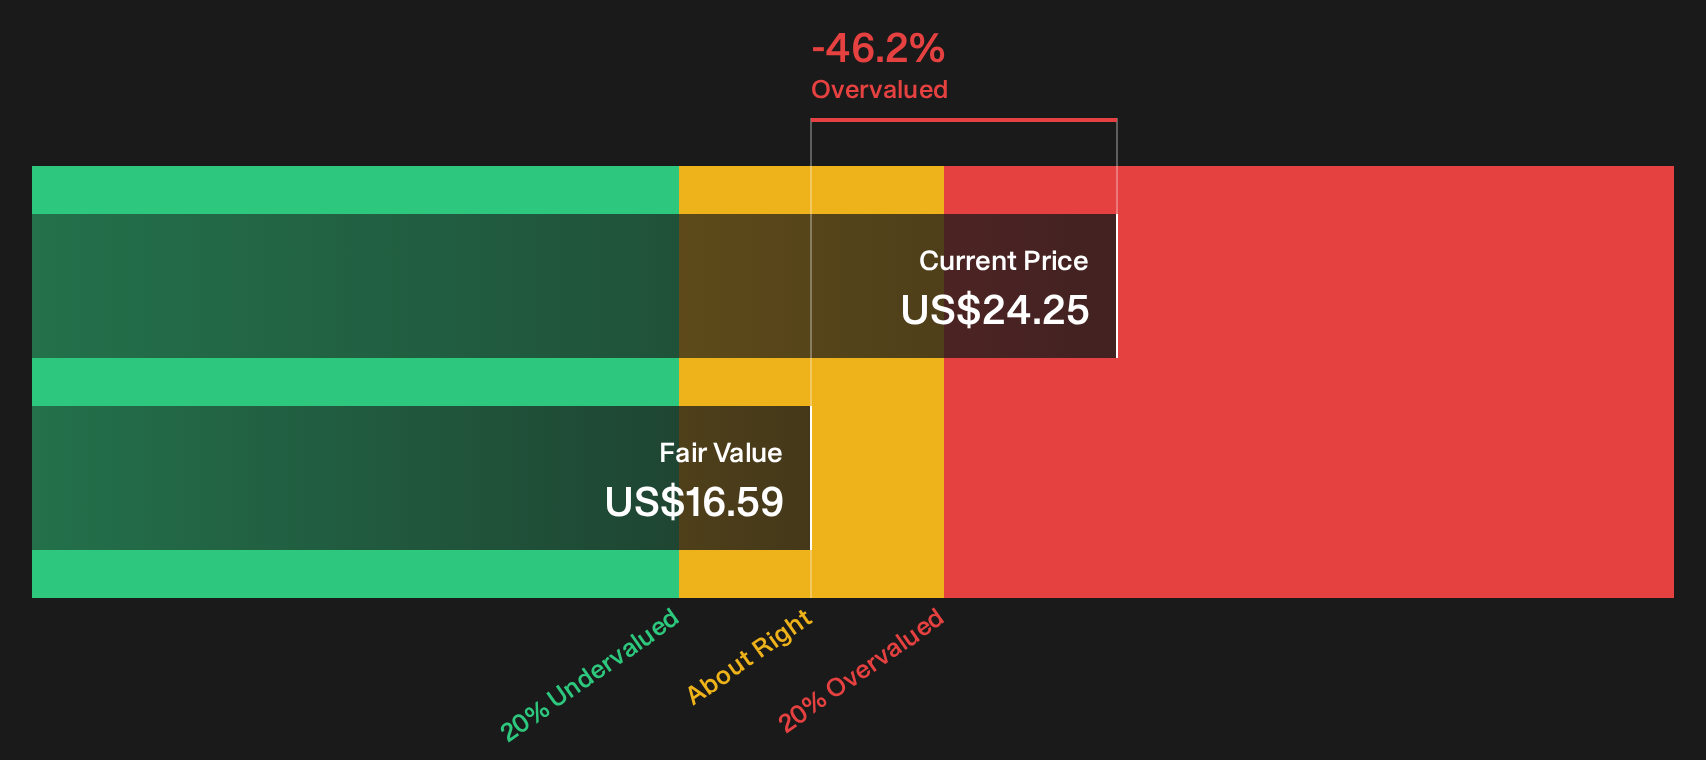
Simply Wall St performs a discounted cash flow (DCF) on every stock in the world every day (check out DRDGOLD for example). We show the entire calculation in full. You can track the result in your watchlist or portfolio and be alerted when this changes, or use our stock screener to discover 31 high quality undervalued stocks. If you save a screener we even alert you when new companies match - so you never miss a potential opportunity.
Next Steps
Mixed signals about DRDGOLD's value story can feel unresolved, so move quickly, review the numbers for yourself, and weigh both sides of the case using the 2 key rewards and 2 important warning signs
Ready for more ideas beyond DRDGOLD?
Once you have a view on DRDGOLD, do not stop there. Broaden your watchlist and pressure test your thesis against other opportunities that fit your style.
- Target resilient balance sheets and steady fundamentals by running a focused search through the list of solid balance sheet and fundamentals (25 results).
- Hunt for compelling value situations where quality and pricing line up using the 31 high quality undervalued stocks.
- Zero in on lesser known opportunities with strong underpinnings before they gain wider attention by checking the 19 high quality undiscovered gems.
This article by Simply Wall St is general in nature. We provide commentary based on historical data and analyst forecasts only using an unbiased methodology and our articles are not intended to be financial advice. It does not constitute a recommendation to buy or sell any stock, and does not take account of your objectives, or your financial situation. We aim to bring you long-term focused analysis driven by fundamental data. Note that our analysis may not factor in the latest price-sensitive company announcements or qualitative material. Simply Wall St has no position in any stocks mentioned.
Have feedback on this article? Concerned about the content? Get in touch with us directly. Alternatively, email editorial-team@simplywallst.com