
Is Kyowa Kirin (TSE:4151) Cheap As Its Knight Therapeutics Deal Opens Latin America?
Kyowa Kirin (TSE:4151) is back on investors’ radar after its subsidiary Kyowa Kirin International signed an exclusive deal with Knight Therapeutics to distribute Poteligeo in key Latin American markets.
Kyowa Kirin’s recent distribution announcement lands after a weak patch for the shares, with a 30-day share price return down 14.61% and a 90-day share price return down 13.85%, while the 1-year total shareholder return has slipped 0.77%. This hints at fading momentum despite the latest partnership-driven catalyst.
Scan beyond Kyowa Kirin and review a curated 76 high quality undiscovered gems that could be setting up for a momentum shift following recent news or price pressure.
Kyowa Kirin shares have slid while its Latin American Poteligeo push is just getting started. Does it make more sense to step in after this pullback, or wait and see what the current valuation actually looks like?
Price-to-Earnings of 14.8x: Is it justified for Kyowa Kirin?
On simple headline numbers, Kyowa Kirin trades on a P/E of 14.8x, which leaves the stock looking slightly more expensive than the broader Japanese pharmaceuticals group but still below the peer average used in this analysis.
The P/E ratio compares the share price with earnings per share and lets you gauge how much investors are paying for each unit of profit. For a pharmaceuticals business like Kyowa Kirin, that metric often reflects how durable the product portfolio looks and how confident the market feels about future profit streams.
Here, the picture is mixed. Earnings over the past year grew 111.7% and have increased 5.7% per year over five years, and the firm is assessed as having high quality earnings, yet profits are forecast to rise a modest 3.7% annually and both expected earnings and revenue growth are projected to be slower than the wider JP market. That kind of profile can justify a middle-of-the-road valuation, where strong recent profit momentum and higher net margins sit against lower projected growth and a Return on Equity of 8.9% that is flagged as low.
Relative to the sector, the contrast is clearer. The 14.8x P/E is described as expensive compared with the JP Pharmaceuticals industry average of 14.1x, but it is also assessed as good value versus the peer average of 15.6x and an estimated fair P/E of 20.9x that our fair ratio work suggests the market could move towards if conditions allowed. That combination points to a stock that is priced a touch rich against the immediate industry, while still screened as undervalued once quality and fundamentals are fed into the fair ratio model.
Explore the SWS fair ratio for Kyowa Kirin.
Result: Price-to-Earnings of 14.8x (UNDERVALUED)
Still, Kyowa Kirin faces clear pressure if clinical trial timelines slip or if new therapies fail to win approvals that support its current earnings profile.
Find out about the key risks to this Kyowa Kirin narrative.
Another View on Kyowa Kirin’s Valuation
The P/E work presents Kyowa Kirin as modestly cheap, and the SWS DCF model goes further. From that perspective, the shares at ¥2,294.5 are trading about 37.6% below an estimated future cash flow value of roughly ¥3,679 per share, which indicates a deeper margin of safety. Could that gap simply reflect execution risk and slower forecast growth, or is the market overreacting to the recent share price slide?
Look into how the SWS DCF model arrives at its fair value.
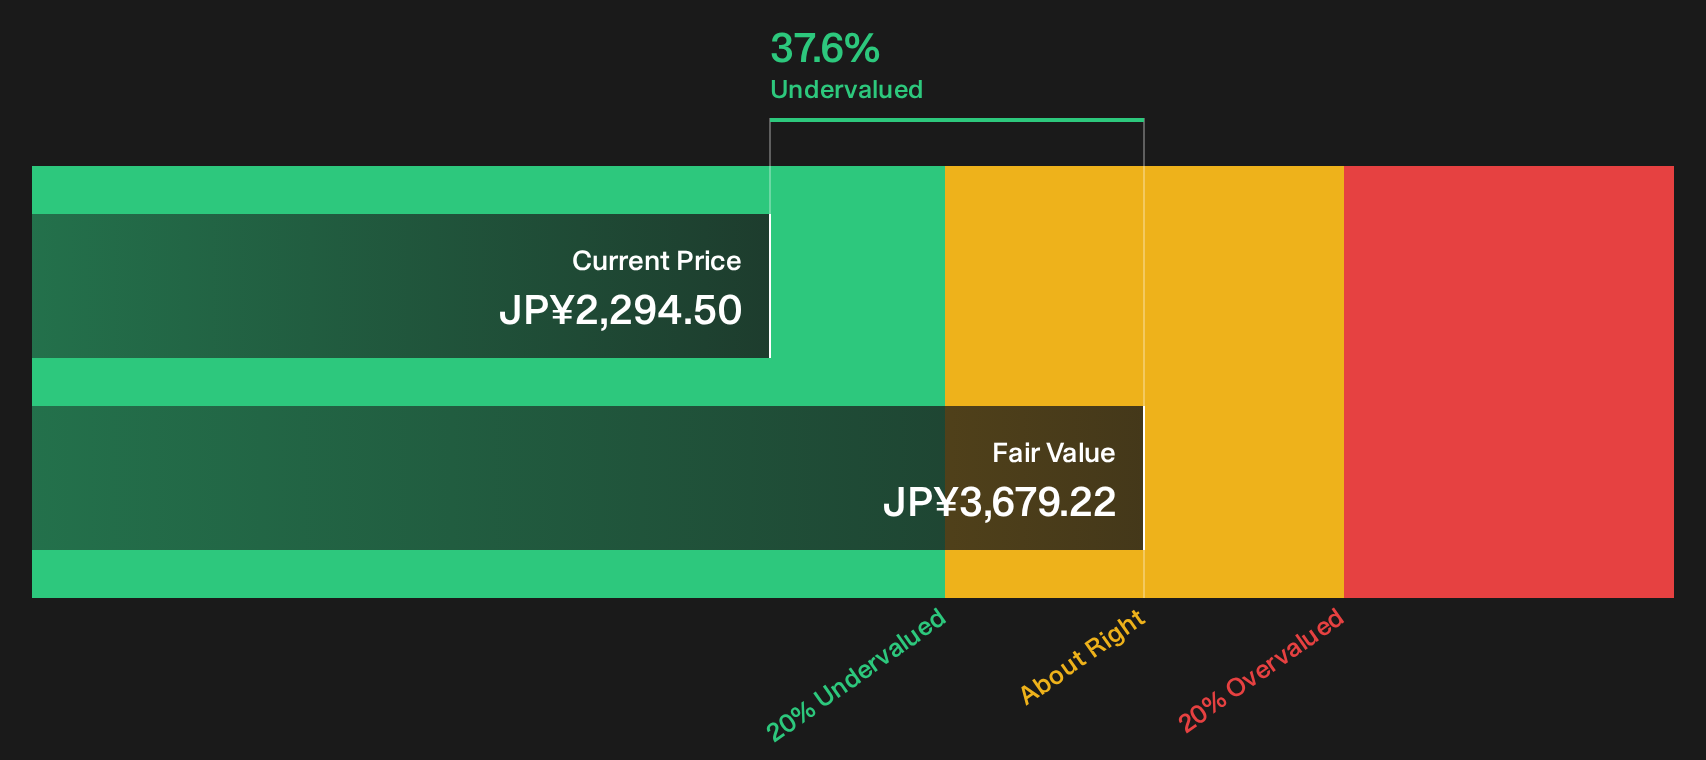
Simply Wall St performs a discounted cash flow (DCF) on every stock in the world every day (check out Kyowa Kirin for example). We show the entire calculation in full. You can track the result in your watchlist or portfolio and be alerted when this changes, or use our stock screener to discover 16 high quality undervalued stocks. If you save a screener we even alert you when new companies match - so you never miss a potential opportunity.
Next Steps
Sentiment around Kyowa Kirin is mixed, which is exactly when independent analysis matters most. Move quickly, study the underlying metrics yourself and then weigh up the 4 key rewards.
Looking for more Kyowa Kirin investment ideas?
If Kyowa Kirin has sharpened your focus, do not stop here. Broader idea sourcing often separates average outcomes from genuinely thoughtful portfolio decisions.
- Target potential mispricings by scanning a 16 high quality undervalued stocks that filters for quality fundamentals at prices that may not fully reflect them yet.
- Prioritise resilience and sleep-at-night holdings by reviewing a 21 resilient stocks with low risk scores that highlights businesses with sturdier financial profiles.
- Strengthen your core holdings by checking a list of solid balance sheet and fundamentals (23 results) that surfaces companies with robust finances and cleaner balance sheets.
This article by Simply Wall St is general in nature. We provide commentary based on historical data and analyst forecasts only using an unbiased methodology and our articles are not intended to be financial advice. It does not constitute a recommendation to buy or sell any stock, and does not take account of your objectives, or your financial situation. We aim to bring you long-term focused analysis driven by fundamental data. Note that our analysis may not factor in the latest price-sensitive company announcements or qualitative material. Simply Wall St has no position in any stocks mentioned.
Have feedback on this article? Concerned about the content? Get in touch with us directly. Alternatively, email editorial-team@simplywallst.com