
Does Revenue Miss Change The Bull Case For Avis Budget Group Stock (CAR)?
- Avis Budget Group recently reported a mixed quarter, with revenue declining year on year and falling short of analyst forecasts, while EBITDA came in ahead of expectations as management adjusted fleet size and utilization to match softer booking trends.
- The stronger EBITDA outcome, driven by rapid fleet and utilization changes, highlights how Avis Budget Group is relying on cost control and operational flexibility when demand and top-line traction are under pressure.
- We will now look at how this revenue miss, alongside better EBITDA, reshapes the broader investment narrative around Avis Budget Group.
Spot other travel stocks where operational discipline and valuation still look compelling by scanning our curated list of 19 high quality undiscovered gems alongside Avis Budget Group today.
Avis Budget Group Investment Narrative Recap
A shareholder in Avis Budget Group needs to believe the rental platform can turn its operational flexibility into more reliable earnings over time. The recent quarter reinforces that idea on the cost side, but the revenue decline and softer bookings keep the demand question open. The near term catalyst is whether fleet discipline can protect profitability if top line softness persists. The biggest near term risk is that weaker utilization and pricing pressure offset that cost work.
The latest earnings move the story, but not in a way that breaks it. EBITDA beating expectations suggests the model can adjust quickly, yet the post result share price drop shows the market is focused on revenue quality and demand visibility. For you, the key watchpoints now are booking trends into coming quarters and management’s willingness to balance fleet size, capex and leverage if travel volumes or pricing weaken further.
With no fresh corporate announcements alongside this Q2 update, the most relevant context is Avis Budget Group’s existing push into premium offerings such as Avis First and its work on technology and fleet optimization. The Q2 numbers give you an operational “stress test” of those efforts. Rapid fleet and utilization changes line up with that tech and data focus, which matters as the firm tries to support margins while demand softens.
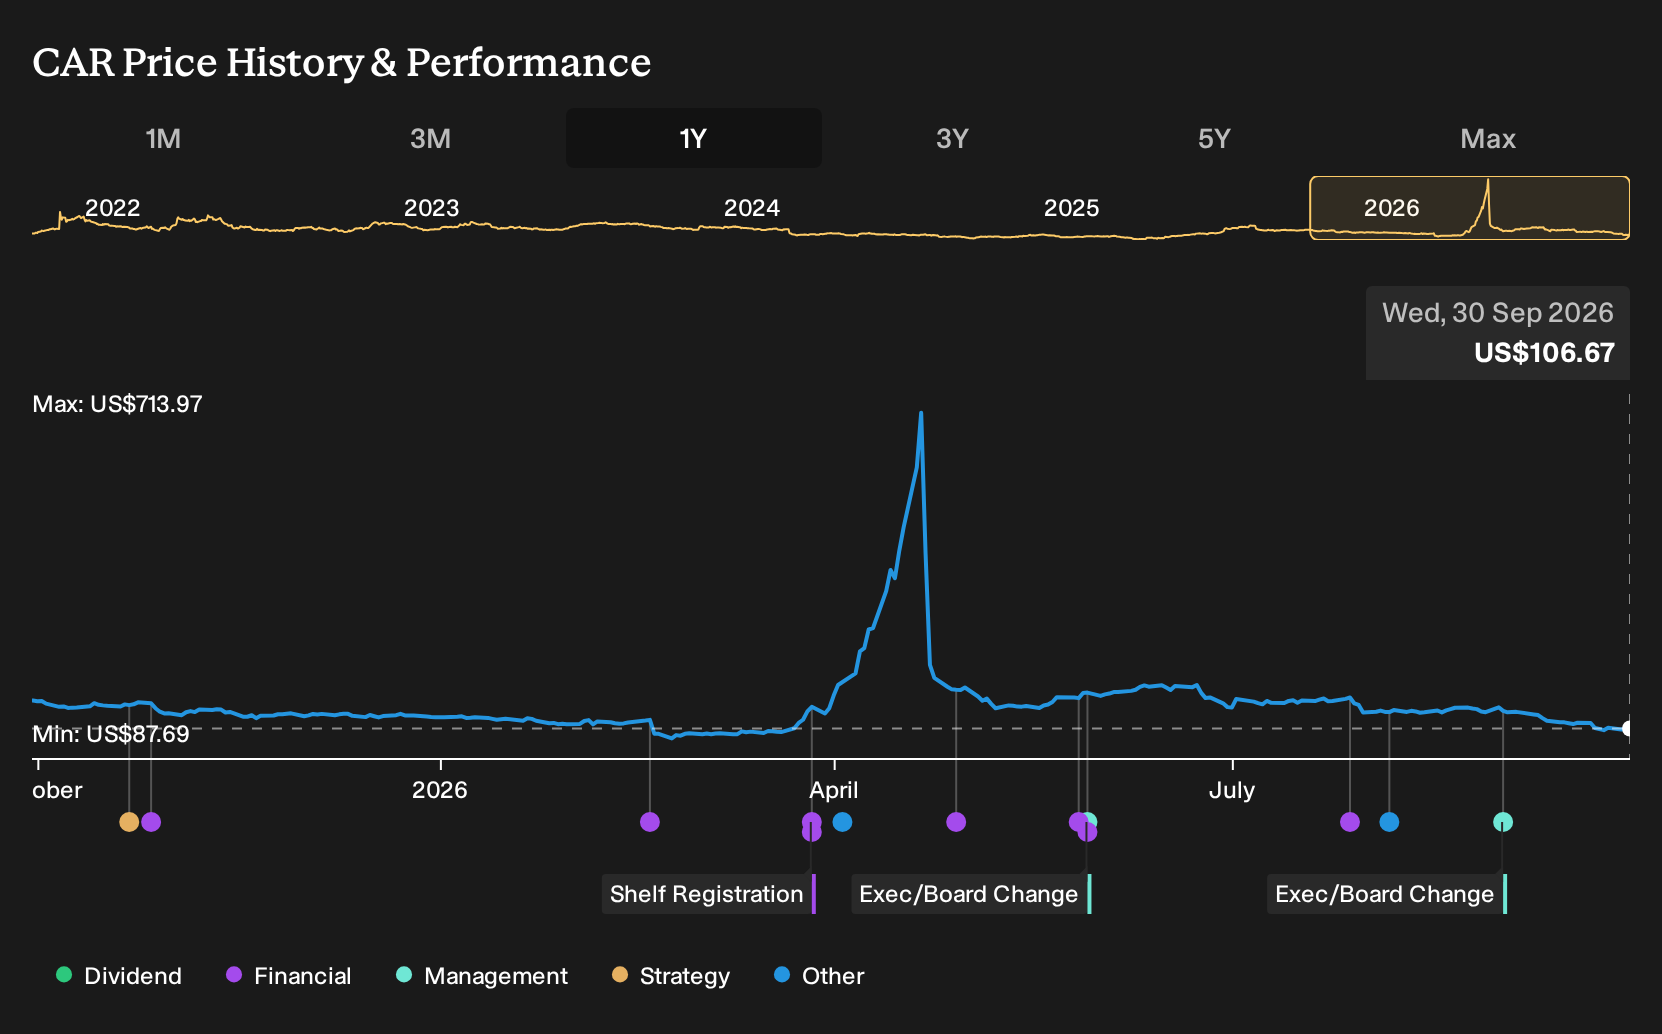
Those earlier initiatives now sit against a rental business that has seen the share price fall sharply over the past 3 months and 1 year. That drop, together with revenue under-shooting and EBITDA outperformance, sharpens the question around execution. Investors are effectively being asked to judge whether cost control, premiumization and digital tools can offset pressures from alternative mobility options, slower revenue forecasts and interest costs that are not well covered by current earnings.
Avis Budget Group's current analyst script points to US$12.2b in revenue and US$613.3m in earnings by 2029. That profile rests on 1.5% yearly revenue growth and an earnings swing of roughly US$1.25b from today’s loss of US$636.0m to the forecast profit level.
Uncover why Avis Budget Group's fair value indicates a 21% potential upside to its current price before the discount closes.
Exploring Other Perspectives
For a very different lens on Avis Budget Group, look at how the most optimistic analysts framed autonomous mobility before this Q2 shock. They were pencilling in US$12.6b of revenue and US$646.3m of earnings by 2029, versus bearish estimates closer to US$409.1m. You should expect those extremes to be revisited as this latest demand wobble sinks in.
Explore 2 other Avis Budget Group fair value estimates, including one that suggests potential upside of as much as 221% from the current price!
Form Your Own Verdict
Disagree with existing narratives? Extraordinary investment returns rarely come from following the herd, so trust your own analysis.
- A great starting point for your Avis Budget Group research is our analysis highlighting 3 key rewards and 2 important warning signs that could impact your investment decision.
- See our latest analysis for Avis Budget Group. The report includes a comprehensive fundamental analysis summarized in a single visual: the Snowflake, making it easy to evaluate Avis Budget Group's overall financial health at a glance.
Looking For More Investment Ideas Beyond Avis Budget Group?
If the Avis Budget Group story has sharpened your thinking on risk, pricing power and balance sheet strength, use that same checklist on a wider watchlist. The Simply Wall St Screener lets you filter for cash generation, leverage, dividend profile and more so you can build a line up that fits your own playbook rather than relying on headlines.
- If resilience matters most to you, start with companies that score well on financial robustness and funding flexibility by reviewing the list of solid balance sheet and fundamentals (25 results).
- If you want potential value upside with quality fundamentals, focus on businesses that pair reasonable valuations with healthy cash flows through the 31 high quality undervalued stocks.
- If smoother income streams appeal more than price swings, concentrate on companies with higher yields and payout consistency using the 7 dividend fortresses.
This article by Simply Wall St is general in nature. We provide commentary based on historical data and analyst forecasts only using an unbiased methodology and our articles are not intended to be financial advice. It does not constitute a recommendation to buy or sell any stock, and does not take account of your objectives, or your financial situation. We aim to bring you long-term focused analysis driven by fundamental data. Note that our analysis may not factor in the latest price-sensitive company announcements or qualitative material. Simply Wall St has no position in any stocks mentioned.
Have feedback on this article? Concerned about the content? Get in touch with us directly. Alternatively, email editorial-team@simplywallst.com