
UBE (TSE:4208) Faces An FTSE Exit As Fair Value Questions Grow
Removal of UBE (TSE:4208) from the FTSE All-World Index on 19 September 2026 puts benchmark-linked selling in focus and prompts investors to reassess how index exclusion might influence liquidity, ownership mix, and near term sentiment.
Against that backdrop, UBE’s share price has eased over the past month, with a 30 day share price return of down 4.76% and a softer 7 day move. Yet the stock still carries a 32.40% year to date share price gain and a 58.69% 1 year total shareholder return, which hints that the recent index exclusion may be cooling what had been strong upward momentum rather than fully reversing longer term optimism.
Compare UBE’s index-driven pullback with other potential opportunities by scanning our curated list of 18 high quality undervalued stocks that shows solid fundamentals and potential for sentiment shifts.
Index removal has cooled UBE’s momentum just as its share price now sits level with analyst targets. Is this caution a healthy reset, or a sign the market is mispricing the business?
Preferred P/E of 13.9x for UBE: Is it justified?
Valuation for UBE now hinges less on index inclusion and more on what investors are willing to pay for each yen of earnings, with the stock trading on a P/E of 13.9x against a last close of ¥3,400.
The P/E ratio compares a company’s share price to its earnings per share and is often used for established businesses where profits, rather than revenue growth, are the main focus. For a diversified materials and machinery group like UBE, this measure helps you gauge how much the market is charging for current and expected profitability, especially now that the business has recently moved into the black.
Here the picture is mixed. Earnings are forecast to grow 8.6% per year, which is slower than the wider JP market forecast of 9.2% and comes alongside an expected 0.4% annual revenue decline over the next three years. Return on equity is currently 5.3% and is projected to remain low at 6.7%, so the current earnings multiple implies investors are paying up for profits that analysts expect to grow steadily rather than aggressively. The SWS fair P/E estimate sits higher at 15.4x, which signals that if the model is correct, market pricing could eventually drift closer to that level.
Relative comparisons are important. UBE’s 13.9x P/E screens as expensive when set against the JP Chemicals industry average of 12.5x, yet looks cheap versus a 20x peer average. That contrast suggests investors are assigning UBE a richer tag than the broader chemicals sector but a discount to a basket of closer peers, perhaps reflecting the company’s diversified segments and recent swing into profitability.
Explore the SWS fair ratio for UBE.
Result: Price-to-earnings of 13.9x (ABOUT RIGHT)
Still, softer revenue guidance and a projected dip in sales, alongside the loss of FTSE All World index support, could weaken conviction in UBE’s current P/E story.
Find out about the key risks to this UBE narrative.
Another View on UBE’s Value: DCF Sends a Harsher Signal
Where the P/E of 13.9x presents UBE as roughly fairly priced against its earnings, the SWS DCF model points in a very different direction. With the share price at ¥3,400 versus an estimated future cash flow value of ¥1,240.93, the stock appears overvalued on this measure.
That is a wide gap for any investor to hold in mind. It raises a simple question: Is the market correctly pricing in a cash flow profile that the model is missing, or is sentiment running ahead of fundamentals?
Look into how the SWS DCF model arrives at its fair value.
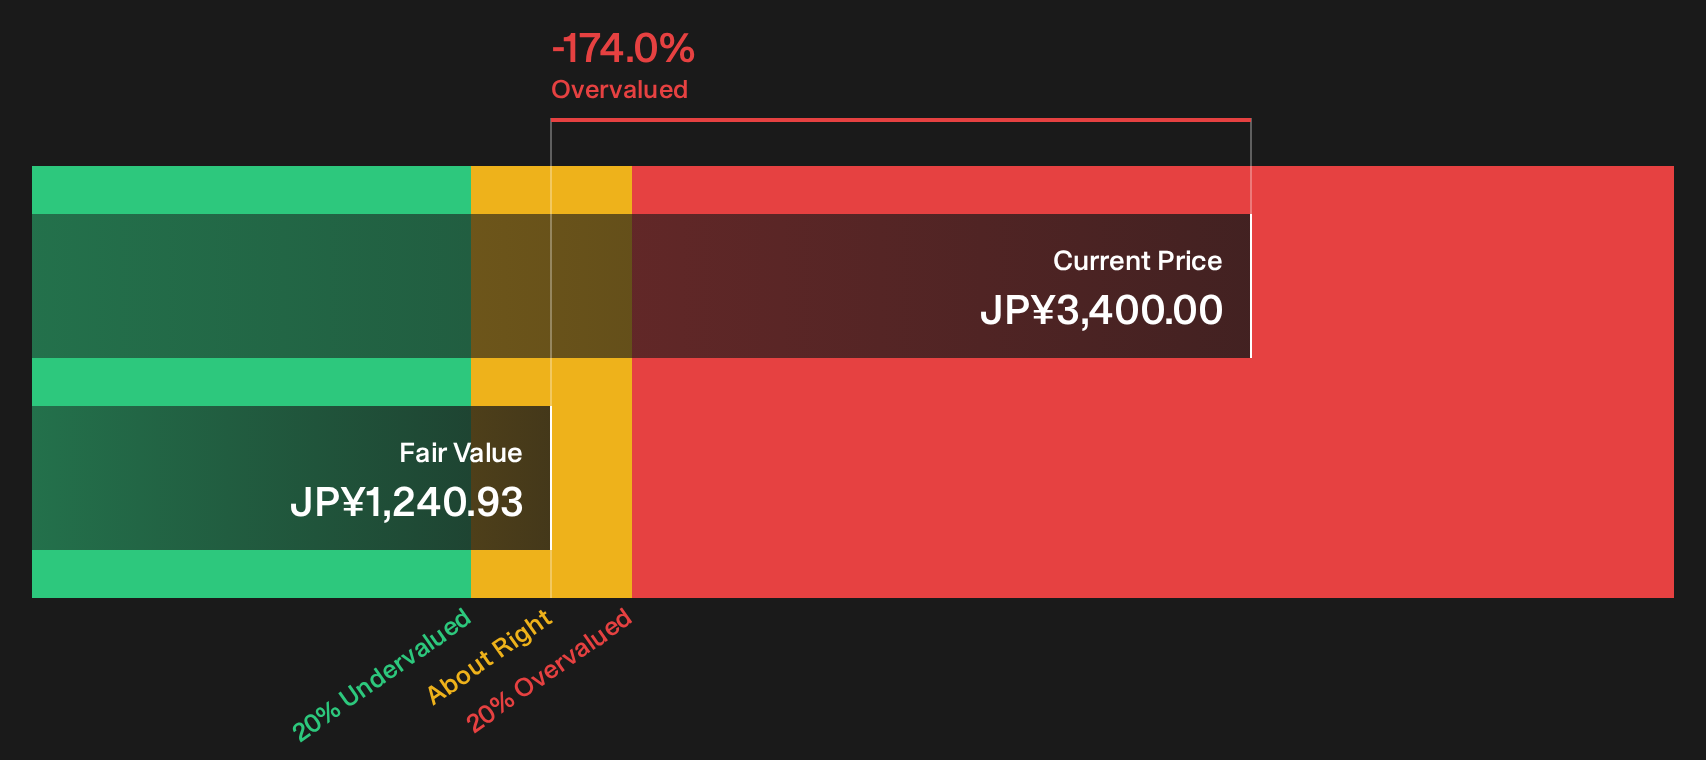
Simply Wall St performs a discounted cash flow (DCF) on every stock in the world every day (check out UBE for example). We show the entire calculation in full. You can track the result in your watchlist or portfolio and be alerted when this changes, or use our stock screener to discover 18 high quality undervalued stocks. If you save a screener we even alert you when new companies match - so you never miss a potential opportunity.
Next Steps
Mixed signals around UBE’s valuation and index status only matter if you turn them into your own clear stance. Move quickly and stress test both sides of the story by weighing up the 2 key rewards and 2 important warning signs
Looking for more investment ideas beyond UBE?
If you want a broader watchlist than UBE alone, put the Simply Wall St Screener to work and let the data surface fresh possibilities for you.
- Spot potential turnaround stories early by scanning 1 elite penny stocks with strong financials that already show stronger financial footing than many expect.
- Hunt for stronger value opportunities by reviewing our curated 18 high quality undervalued stocks that combine quality fundamentals with room for a re-rate.
- Prioritise resilience in tougher markets by focusing on our 21 resilient stocks with low risk scores that score well on financial strength and risk controls.
This article by Simply Wall St is general in nature. We provide commentary based on historical data and analyst forecasts only using an unbiased methodology and our articles are not intended to be financial advice. It does not constitute a recommendation to buy or sell any stock, and does not take account of your objectives, or your financial situation. We aim to bring you long-term focused analysis driven by fundamental data. Note that our analysis may not factor in the latest price-sensitive company announcements or qualitative material. Simply Wall St has no position in any stocks mentioned.
Have feedback on this article? Concerned about the content? Get in touch with us directly. Alternatively, email editorial-team@simplywallst.com