
Genfit (ENXTPA:GNFT) Stock Slides As Wider Losses Deepen Turnaround Doubts
The market has been treating Genfit like a high risk turnaround story, and the share price reflects that mood, with the stock down about 30% over the past month and weaker again in the last week. The headline from this half year is not revenue; the story is the size of the loss. Management reported a net loss of €26.12m for H1 2026 and basic earnings per share of €0.52 in the red, which keeps the spotlight firmly on how much balance sheet strain investors are being asked to tolerate.
Concerned that Genfit is still asking you to tolerate sizeable losses with no clear line of sight to steadier earnings, yet want exposure to healthcare potential without as much balance sheet strain? Consider benchmarking GNFT against our curated list of companies in the list of solid balance sheet and fundamentals stocks (205 results)
H1 2026 Earnings Summary
- Revenue (H1 2026 vs. H1 2025): €25.033m vs. €35.535m (decline in reported revenue)
- Net Loss (H1 2026 vs. H1 2025): loss of €26.12m vs. loss of €9.956m (wider loss period on period)
- Basic EPS (H1 2026 vs. H1 2025): loss of €0.52 per share vs. loss of €0.20 per share (larger loss per share)
- R&D Pipeline (TTM to H1 2026 vs. TTM to H2 2025): 2 products in Phase I and 1 product in Phase III vs. the same reported in the prior trailing period (no reported change in late stage pipeline)
Tired of scrolling through dense earnings releases and raw numbers trying to make sense of Genfit? See the full visual picture of the business with a clear view of its valuation in our company report for Genfit.
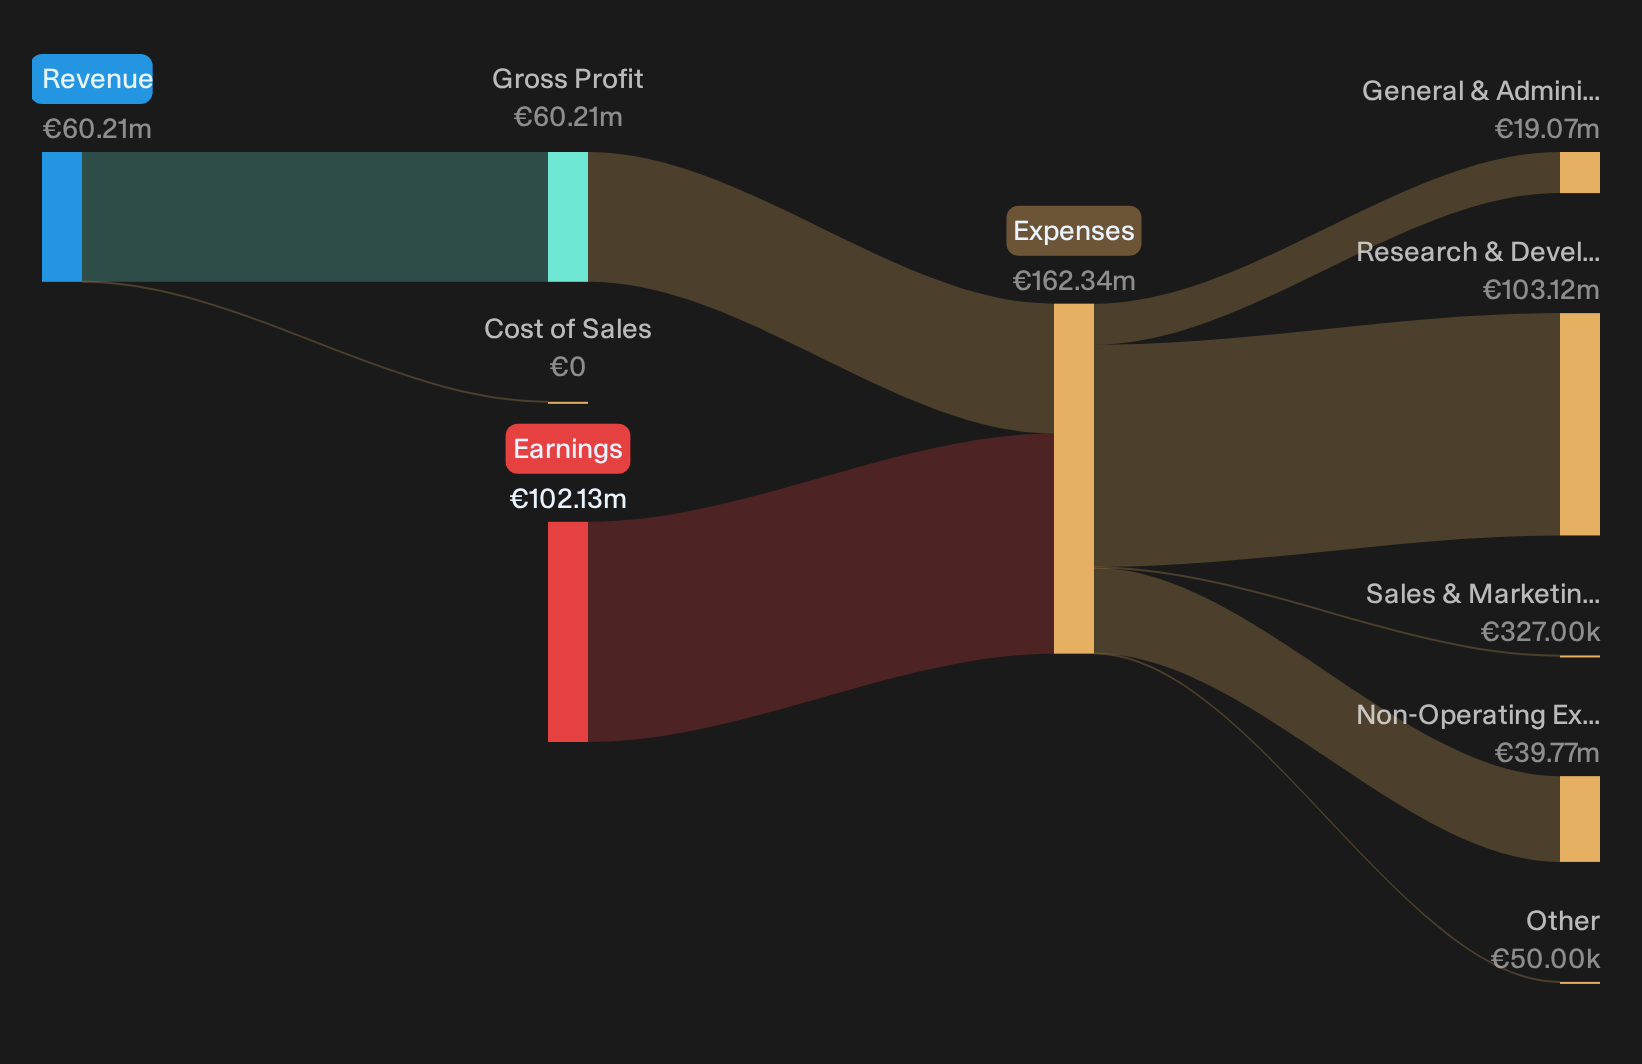
Genfit bull story hits volume and leverage hurdles
Bulls frame Genfit as a royalty engine on NIS2+, where a growing MASH testing pool and an eventual IVD kit launch would aim to turn fixed costs into earnings power. The latest half pushes back on that timeline. Reported revenue of €25.033m is well below the €35.535m booked a year earlier, while the net loss widened to €26.12m and the per share loss moved from €0.20 to €0.52. That pattern points to limited operating leverage so far. The R&D pipeline shows 1 product in Phase III and 2 in Phase I, the same count as the prior trailing period, so there is no visible step up in late stage assets that could quickly diversify income. The core upside story around fast expanding NIS2+ royalties and stronger cash generation remains framed as an ambition, but the current print does not show it taking hold yet.
Bear case on losses and dependency gains traction
Skeptics argue that slow NIS2+ uptake, reliance on partners and constrained royalty economics leave Genfit carrying the cost base without the offsetting inflows. The half year numbers reinforce several of those worries. Revenue moved down to €25.033m while the loss widened to €26.12m, with a deeper €0.52 per share in the red. That combination of weaker top line and higher deficit suggests royalty and collaboration income are not yet scaling against expenses. The unchanged late stage pipeline count also means no new Phase III asset to ease dependence on the existing diagnostic franchise and its partners. With the share price down about 30% over 30 days and lower again over 7 and 90 days, the market reaction since the H1 2026 update aligns more closely with the bear narrative than with expectations of an imminent earnings ramp.
Compare Genfit's internal turnaround ambitions with what the street is actually pricing in right now. See the consensus price target analysis for GenfitStay Ahead Of Your Next Move
Genfit's widening H1 2026 losses and share price pressure make timing and risk tracking crucial, so register for free with Simply Wall St and add it to your Watchlist to watch how the market price lines up against fair value before deciding on an entry. Once you own it, use the Portfolio Command Center to cut through noise and focus on the updates that actually affect your thesis. For a longer view, tap into thousands of perspectives through the Community and see how other investors are interpreting the same numbers. By spotting potential catalysts and warning signs early, you give yourself a better chance of staying ahead of the market rather than reacting to it late.
Seeking Alternatives Before Momentum Flies Past
Fresh ideas tend to move first, and slow research can get caught chasing breakouts after momentum is already flying. Scan these under the radar for now themes while it matters and consider acting before conditions change.
- Identify income workhorses with punchy yields that could help steady a portfolio and offset more volatile names by scanning our curated 156 dividend fortresses before others bid them up.
- Look for potential long-term compounders where strong balance sheets meet under followed stories using a tight shortlist in the 616 high quality undiscovered gems while valuations still look reasonable.
- Focus on resilient operators that may hold up better when sentiment swings by filtering opportunities through the 226 resilient stocks with low risk scores before the crowd moves more decisively into defensive positioning.
This article by Simply Wall St is general in nature. We provide commentary based on historical data and analyst forecasts only using an unbiased methodology and our articles are not intended to be financial advice. It does not constitute a recommendation to buy or sell any stock, and does not take account of your objectives, or your financial situation. We aim to bring you long-term focused analysis driven by fundamental data. Note that our analysis may not factor in the latest price-sensitive company announcements or qualitative material. Simply Wall St has no position in any stocks mentioned.
Have feedback on this article? Concerned about the content? Get in touch with us directly. Alternatively, email editorial-team@simplywallst.com