
ZO Future Group (SEHK:2309) Stock Faces Valuation Pressure As Losses Persist
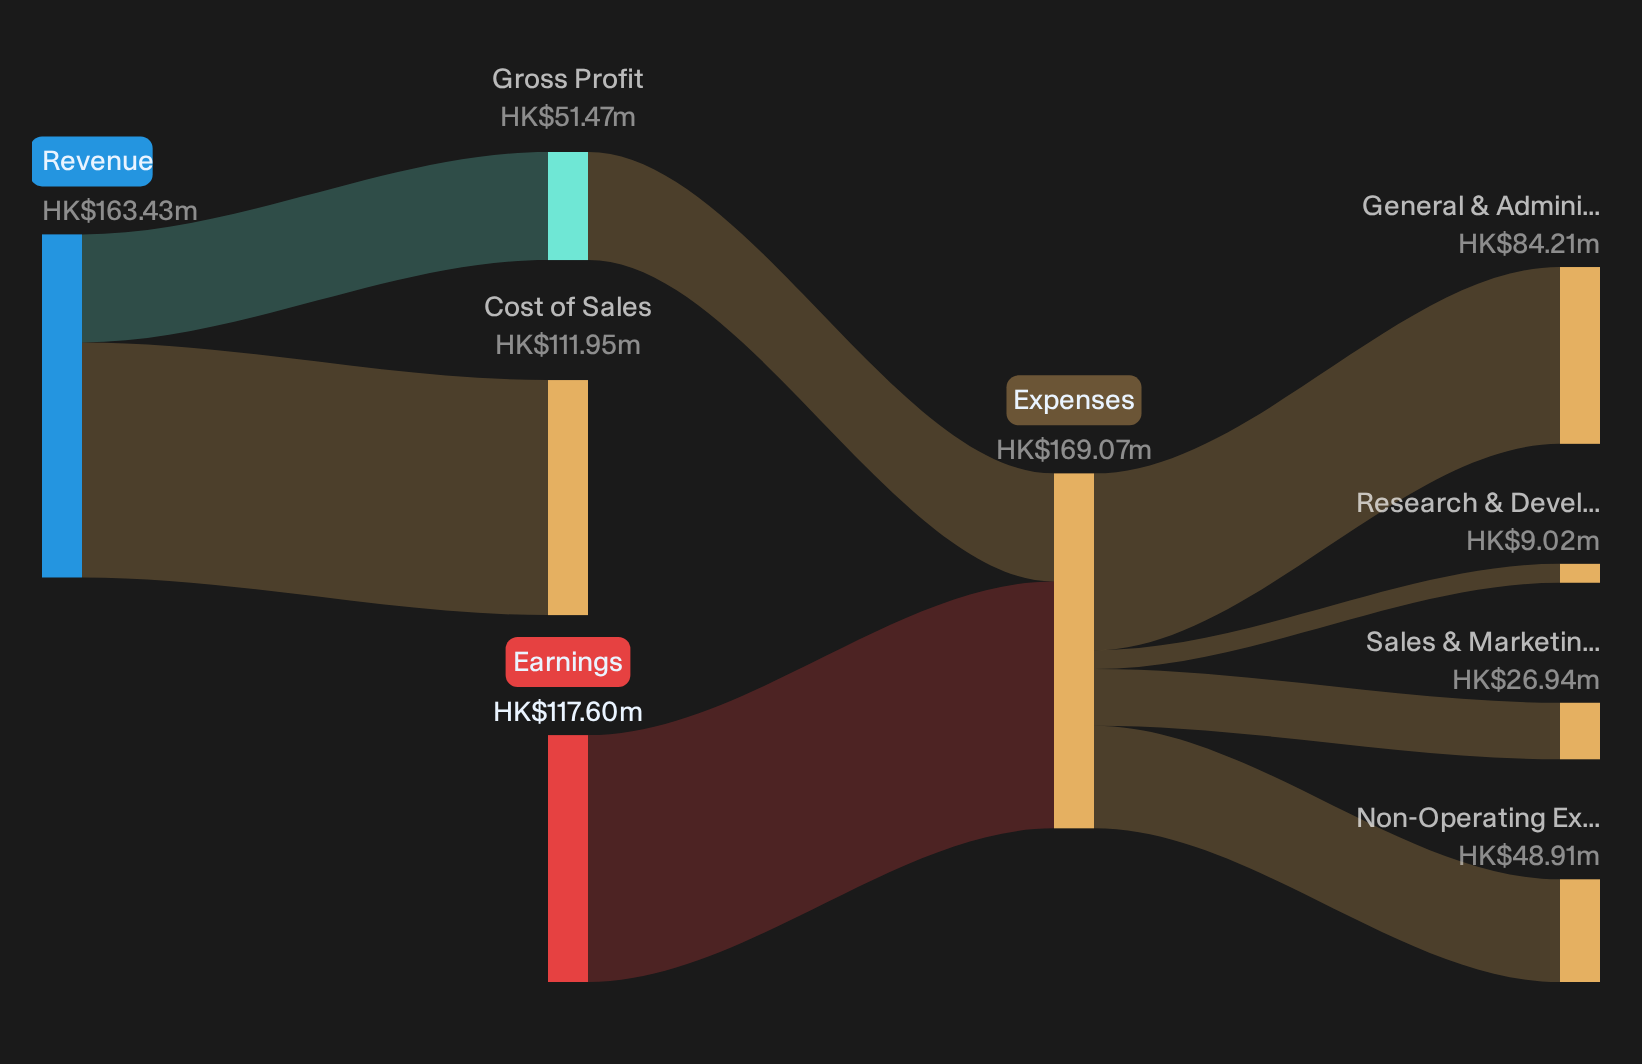
The market has already marked ZO Future Group down, with the stock trailing roughly 17% over the past week and about 21% over three months. That pessimism met a harsh reality in the latest filing. The headline is not revenue; it is the deepening loss profile. Management reported a full year loss of HK$117.6 million from ongoing operations and a basic loss per share of HK$0.13. For a company still valued at a P/S of 9.6x, that combination of a rich sales multiple and persistent red ink is what investors are now re-pricing.
Love the revenue story at ZO Future Group but concerned about the deepening losses and rich P/S multiple? Consider using our screener of stocks that pair healthier cash generation with more grounded valuations in the list of solid balance sheet and fundamentals stocks (205 results)
FY 2026 Earnings Summary
- Revenue (FY 2026 vs. FY 2025 PCP): HK$163.425 million vs. HK$451.190 million (top line declined 63.8%)
- Net Loss from Continuing Operations (FY 2026 vs. FY 2025 PCP): HK$119.171 million loss vs. HK$511.980 million loss (loss from core business narrowed 76.7%)
- Basic EPS (FY 2026 vs. FY 2025 PCP): HK$0.127441 loss per share vs. HK$0.380378 loss per share (per share loss reduced 66.5%)
- Net Income Excluding Extra Items (FY 2026 vs. FY 2025 PCP): HK$117.601 million loss vs. HK$313.961 million loss (underlying loss contracted 62.5%)
Prefer clean visual charts over slogging through dense earnings tables and footnotes for ZO Future Group? See the full financial picture, including a clear view of the loss profile and valuation context, in the interactive company report for ZO Future Group.
ZO Future Group: Testing The Optimistic Story
For anyone leaning positive on ZO Future Group, the clearest support comes from the loss line, not the top line. Net loss from continuing operations narrowed to HK$119.171 million and basic loss per share also reduced, which points to improving cost control or a cleaner business mix. Underlying loss excluding extra items moved in the same direction. That kind of consistency suggests the restructuring story has some traction, even though revenue sits at HK$163.425 million and the share price has declined over 7 days, 30 days and 90 days.
ZO Future Group: Where The Risks Still Bite
The flip side is hard to ignore. Revenue of HK$163.425 million is below the prior comparative period and the business still reports a triple digit million loss. That keeps questions alive about scale and profit potential across football, property and new energy automobiles. The stock falling over the past week, month and quarter suggests investors remain cautious about how quickly this portfolio can deliver sustainable earnings. Losses are shrinking, but the company is not yet generating profits, so the turnaround story still needs further proof in future filings.
Review whether ZO Future Group's shrinking losses and short cash runway hint at deeper structural issues by reading the full risk analysis for ZO Future Group which shows 2 important warning signsTake Charge Of Your Next Move
If the mix of shrinking losses and a still-rich P/S for ZO Future Group has your attention, register for free with Simply Wall St and add it to a Watchlist so you can track price against fair value and watch for a more attractive entry point. Once you decide to build or adjust a position, use the Portfolio Command Center to cut through the noise and surface only the key developments that matter to your holdings. For a broader view on sentiment and thesis checks over time, tap into the Community to see how other investors are thinking through the same risks and opportunities. By spotting hidden catalysts and pressure points early, you put yourself in a stronger position to stay ahead of the market.
Seeking Alternatives Beyond ZO Future Group?
Fresh ideas move fast. Some are building quiet breakout momentum, others could be dropping into bargain territory under the radar for now. Scan these shortlists before the crowd and act now.
- Spot potential breakout stories with stronger balance sheets and cash discipline by sifting through a curated set of resilient businesses in the 226 resilient stocks with low risk scores.
- Chase income opportunities while yields still look compelling by reviewing a hand picked pool of steady payers in the 161 dividend fortresses.
- Hunt for fresh growth angles beyond ZO Future Group by screening a tight group of future facing operators in the 25 quantum computing stocks.
This article by Simply Wall St is general in nature. We provide commentary based on historical data and analyst forecasts only using an unbiased methodology and our articles are not intended to be financial advice. It does not constitute a recommendation to buy or sell any stock, and does not take account of your objectives, or your financial situation. We aim to bring you long-term focused analysis driven by fundamental data. Note that our analysis may not factor in the latest price-sensitive company announcements or qualitative material. Simply Wall St has no position in any stocks mentioned.
Have feedback on this article? Concerned about the content? Get in touch with us directly. Alternatively, email editorial-team@simplywallst.com