
Global's Top 3 Undervalued Small Caps With Insider Buying
In recent weeks, the global market has seen mixed signals with small-cap stocks facing a pullback, as indicated by the Russell 2000 Index, amid broader economic activity accelerating at its fastest pace in over five years. As investors navigate this complex landscape, identifying potentially undervalued small-cap stocks with insider buying can offer unique opportunities for those looking to capitalize on growth potential within this dynamic segment.
Top 10 Undervalued Small Caps With Insider Buying Globally
| Name | PE | PS | Discount to Fair Value | Value Rating |
|---|---|---|---|---|
| Q Technology (Group) | 3.5x | 0.2x | 43.21% | ★★★★★☆ |
| China Aircraft Leasing Group Holdings | 7.1x | 0.9x | 37.50% | ★★★★★☆ |
| Transcontinental | 2.5x | 0.2x | -100.67% | ★★★★☆☆ |
| Franchise Brands | 27.7x | 2.0x | 46.81% | ★★★★☆☆ |
| Pizza Pizza Royalty | 11.7x | 9.0x | 42.16% | ★★★★☆☆ |
| Trifast | NA | 0.5x | 13.14% | ★★★★☆☆ |
| Linc | 12.1x | 12.6x | 34.51% | ★★★★☆☆ |
| Diversified Royalty | 25.4x | 10.1x | 46.71% | ★★★☆☆☆ |
| Firan Technology Group | 41.5x | 3.1x | 13.47% | ★★★☆☆☆ |
| Coveo Solutions | NA | 1.9x | -23.84% | ★★★☆☆☆ |
Let's explore several standout options from the results in the screener.
Lendlease Group (ASX:LLC)
Simply Wall St Value Rating: ★★★☆☆☆
Overview: Lendlease Group is a global property and infrastructure company engaged in development, investments, and construction activities, with a market cap of approximately A$6.89 billion.
Operations: Lendlease Group generates revenue primarily from its Construction segment, which contributes A$3.87 billion, followed by Development and Capital Release Unit segments. The company's gross profit margin has shown fluctuations over time, reaching 8.05% in the most recent quarter ending September 2026. Operating expenses have varied, with a significant portion attributed to general and administrative costs.
PE: -2.4x
Lendlease, a smaller player in the market, faces challenges with external borrowing as its sole funding source. Despite reporting a net loss of A$749 million for the year ending June 2026, earnings are projected to grow over 80% annually. Insider confidence is evident with recent board changes; Gary Lennon and Philippa Kelly bring extensive experience to guide strategic transformation. These developments suggest potential for recovery and growth amidst current financial hurdles.
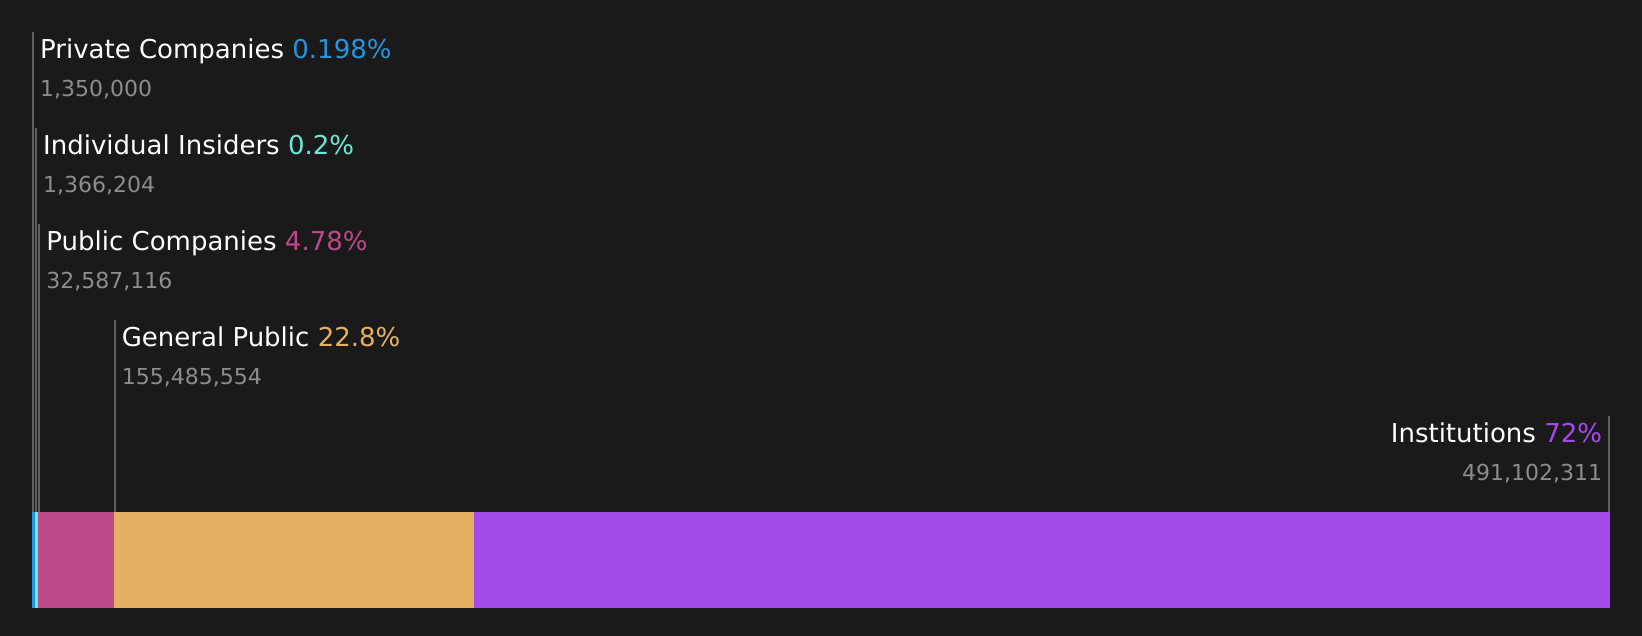
Vitec Software Group (OM:VIT B)
Simply Wall St Value Rating: ★★★★★☆
Overview: Vitec Software Group is a company that specializes in software and programming, with a market capitalization of SEK 15.65 billion.
Operations: The company generates revenue primarily from its Software & Programming segment, with a recent gross profit margin of 48.09%. Operating expenses, including significant general and administrative costs, impact the net income margin, which stands at 12.13%.
PE: 22.9x
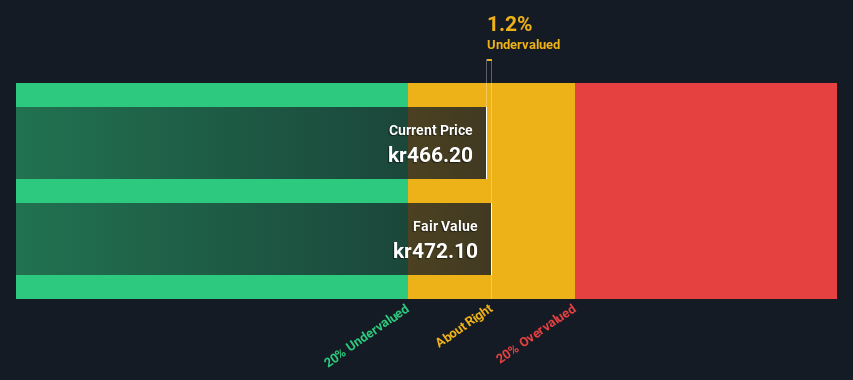
Vitec Software Group, a company with increasing earnings projected to grow 14.02% annually, recently reported substantial financial growth. For the second quarter of 2026, sales rose to SEK 801 million from SEK 713 million the previous year, while revenue increased to SEK 954 million from SEK 817 million. Despite its high debt levels and reliance on external borrowing, Vitec's consistent revenue and income growth highlight potential for future performance in its sector.
Firan Technology Group (TSX:FTG)
Simply Wall St Value Rating: ★★★☆☆☆
Overview: Firan Technology Group is a company engaged in the design and manufacture of printed circuit boards and aerospace components, with a market cap of CA$0.12 billion.
Operations: The company generates revenue primarily from its Circuits and Aerospace segments, with recent figures showing CA$128.46 million and CA$74.58 million respectively. The net income margin has shown variability, reaching 7.50% in the most recent period, while gross profit margin was recorded at 37.25%. Operating expenses have been a significant cost component, including general and administrative expenses that reached CA$29.06 million in the latest quarter.
PE: 41.5x
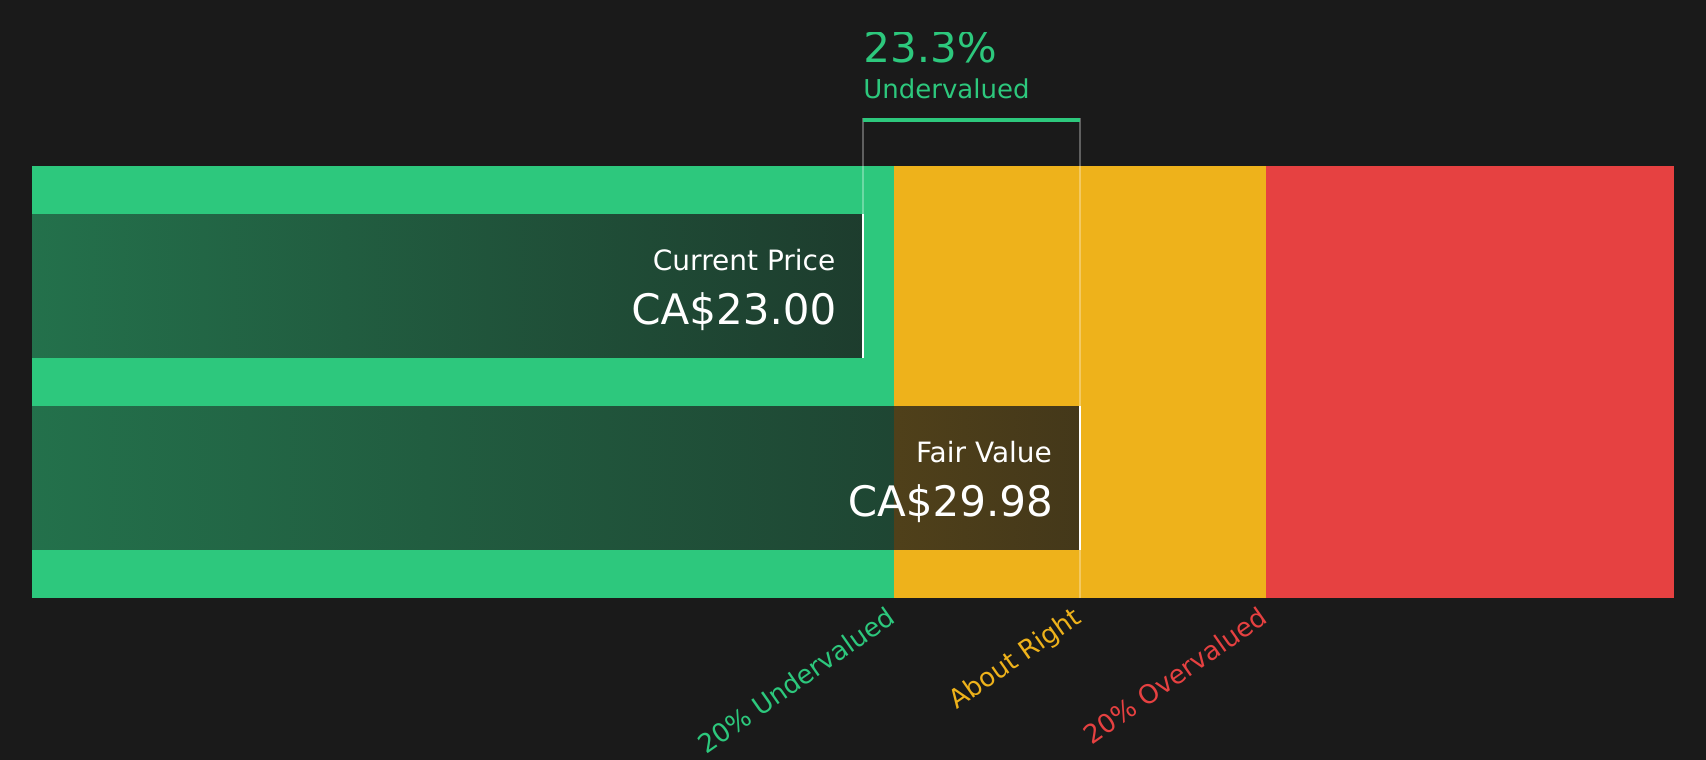
Firan Technology Group, recently added to the S&P Global BMI Index, reported strong financials for Q2 2026 with sales rising to C$52.74 million from C$48.73 million a year ago and net income increasing to C$5.04 million from C$3.48 million. Earnings per share also improved, reflecting growth potential despite reliance on higher-risk external funding sources. Insider confidence is evident through recent share purchases, suggesting belief in future prospects as earnings are forecasted to grow by 22% annually.
- Dive into the specifics of Firan Technology Group here with our thorough valuation report.
Evaluate Firan Technology Group's historical performance by accessing our past performance report.
Next Steps
- Dive into all 118 of the Undervalued Global Small Caps With Insider Buying we have identified here.
- Are these companies part of your investment strategy? Use Simply Wall St to consolidate your holdings into a portfolio and gain insights with our comprehensive analysis tools.
- Invest smarter with the free Simply Wall St app providing detailed insights into every stock market around the globe.
Ready To Venture Into Other Investment Styles?
- Explore high-performing small cap companies that haven't yet garnered significant analyst attention.
- Fuel your portfolio with companies showing strong growth potential, backed by optimistic outlooks both from analysts and management.
- Find companies with promising cash flow potential yet trading below their fair value.
This article by Simply Wall St is general in nature. We provide commentary based on historical data and analyst forecasts only using an unbiased methodology and our articles are not intended to be financial advice. It does not constitute a recommendation to buy or sell any stock, and does not take account of your objectives, or your financial situation. We aim to bring you long-term focused analysis driven by fundamental data. Note that our analysis may not factor in the latest price-sensitive company announcements or qualitative material. Simply Wall St has no position in any stocks mentioned.
Have feedback on this article? Concerned about the content? Get in touch with us directly. Alternatively, email editorial-team@simplywallst.com