
Hubbell (HUBB) Pauses After A Strong Run, Is The Stock Now Cheap?
Hubbell (HUBB) has drawn fresh attention after recent trading left the share price around $459, with the stock roughly flat over the past month but posting a decline over the past 3 months.
Recent trading leaves Hubbell in a holding pattern, with the 90 day share price return down 6.3%, while the year to date share price return is only slightly lower and the 1 year total shareholder return sits at 8.0%. This may suggest cooling momentum following a strong multi year run.
Scan beyond Hubbell and compare this pause in performance with other grid and electrical infrastructure players selected in our 39 power grid technology and infrastructure stocks.
Hubbell has paused after a long stretch of strong multi year returns, which leaves you weighing a pullback entry against simply getting exposure now. So how does the current valuation stack up against that choice?
Most Popular Narrative: 19% Undervalued
Against the last close of $459.09, the most followed narrative pegs Hubbell’s fair value at $566.30, pointing to a sizeable valuation gap that hinges on how grid and electrification demand plays out over time.
Hubbell's Electrical Solutions segment is achieving mid-single-digit organic growth and improved operating margins, bolstered by strong demand in data centers and continuing efforts in business simplification. These factors are cited as potential support for long-term margin expansion and are expected to positively influence revenue and net margins.
See why 17 investors see Hubbell as 19% undervalued.
Result: Fair Value of $566.30 (UNDERVALUED)
Still, that upside narrative for Hubbell leans heavily on pricing keeping up with tariff and raw material cost pressure and on grid automation demand not softening further.
Find out about the key risks to this Hubbell narrative.
Another View on Hubbell’s Valuation
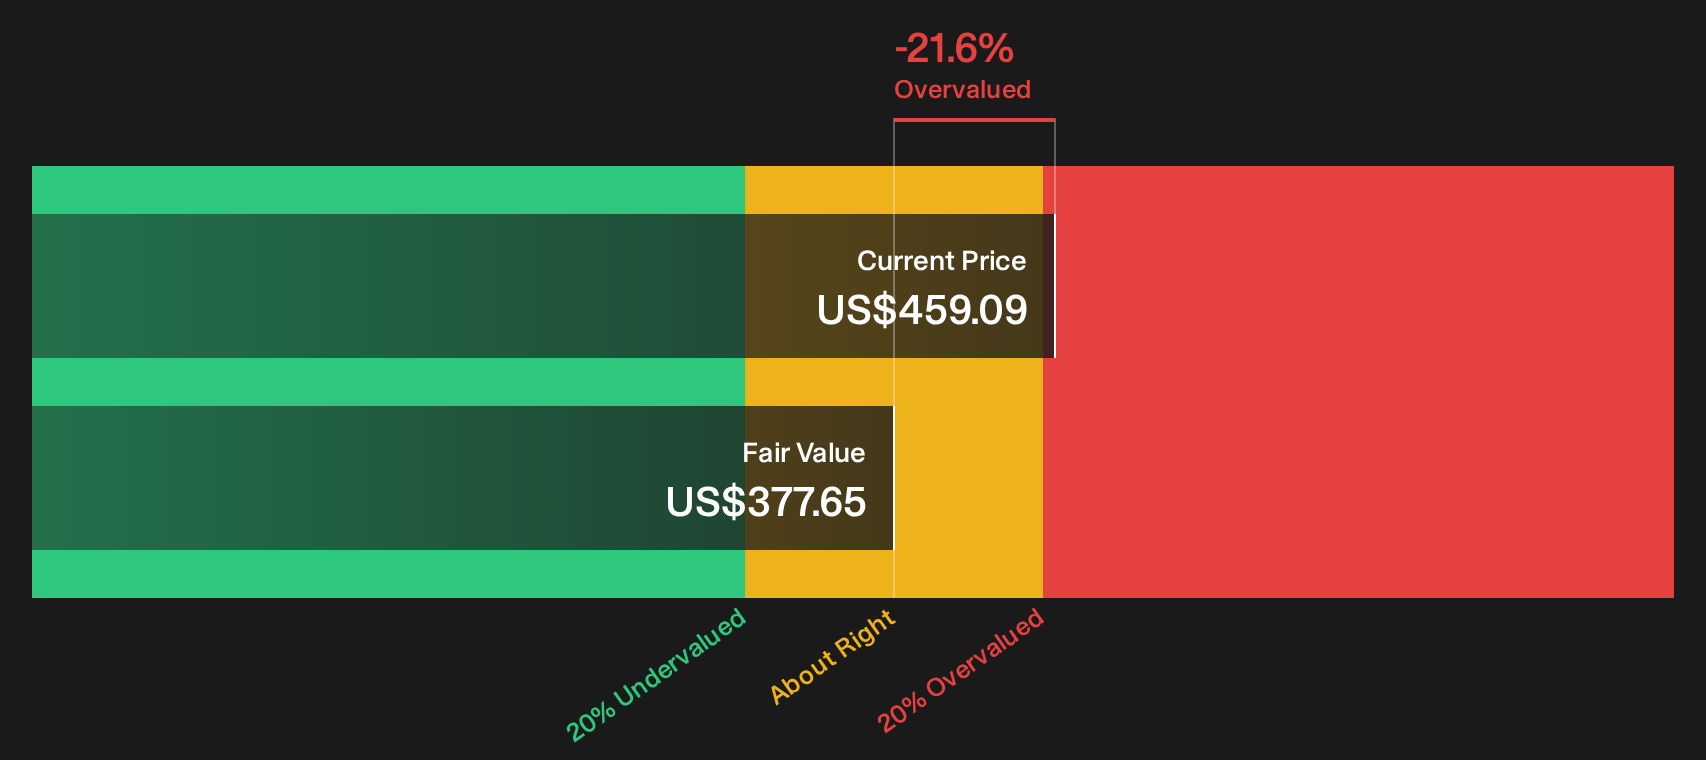
That 19% upside story for Hubbell based on fair value contrasts sharply with our DCF model, which points to a very different conclusion. On a future cash flow basis, the SWS DCF model estimates value at about $377.65 per share, well below the current $459.09 price, which screens as overvalued on this method. For an investor, that raises a simple question: Which lens feels more realistic for how cash flows might actually play out?
Look into how the SWS DCF model arrives at its fair value.
Next Steps
Mixed signals around Hubbell's valuation and future cash flows can feel messy, so move quickly, test the numbers yourself, and weigh both the upside and the caution flagged in our 4 key rewards and 1 important warning sign.
Looking for more investment ideas beyond Hubbell?
If Hubbell has you thinking harder about valuation, do not stop here. Use focused screeners to surface alternatives that fit your risk, income, and quality preferences.
- Target stronger balance sheets by scanning companies with robust financial footing and cleaner leverage profiles through the list of solid balance sheet and fundamentals (25 results).
- Hunt for potential mispricings by filtering for companies that combine quality fundamentals with attractive valuations using the 32 high quality undervalued stocks.
- Build a steadier income stream by reviewing businesses with higher dividend yields and more resilient payout histories inside the 6 dividend fortresses.
This article by Simply Wall St is general in nature. We provide commentary based on historical data and analyst forecasts only using an unbiased methodology and our articles are not intended to be financial advice. It does not constitute a recommendation to buy or sell any stock, and does not take account of your objectives, or your financial situation. We aim to bring you long-term focused analysis driven by fundamental data. Note that our analysis may not factor in the latest price-sensitive company announcements or qualitative material. Simply Wall St has no position in any stocks mentioned.
Have feedback on this article? Concerned about the content? Get in touch with us directly. Alternatively, email editorial-team@simplywallst.com