
ams-OSRAM (SWX:AMS) AI Photonics Push Puts Its Valuation Back In Focus
ams-OSRAM (SWX:AMS) has put next generation photonics for AI in focus after unveiling new thin-film VCSEL building blocks and a connectorized multi-core fiber demonstrator with BizLink at ECOC 2026.
For context, the ams-OSRAM share price has climbed to CHF22.04, with a 1-month share price return of 21.37% and a year-to-date share price return of 155.83%. The 1-year total shareholder return is 98.56%, while the 5-year total shareholder return is down 75.36%, which points to strong recent momentum following a much tougher longer-term journey.
Spot opportunities around ams-OSRAM's AI photonics push by scanning a curated set of 88 AI infrastructure stocks, which are also building the hardware behind next-generation data centers.After a powerful rebound and a fresh AI photonics story, the real tension around ams-OSRAM now is simple. Is the meaningful upside still in front of you, or has the recent surge already captured most of it?
Preferred Price-to-Sales Multiple of 0.7x: Is it justified?
Valuation work around ams-OSRAM currently leans on revenue rather than earnings, since the group reported a loss of €324.0m on €3,329.0m of sales and is assessed as unprofitable. Against that backdrop, the stock is described as trading at good value, with a P/S ratio of 0.7x while the last close sits at CHF22.04.
The P/S multiple compares the market value of the equity with the top line that the business generates, which can be useful when profits are either thin or negative. For a sensor and LED specialist like ams-OSRAM, where net income is presently in the red and profitability is not forecast over the next 3 years, revenue can act as a cleaner anchor for how investors are currently valuing each unit of sales.
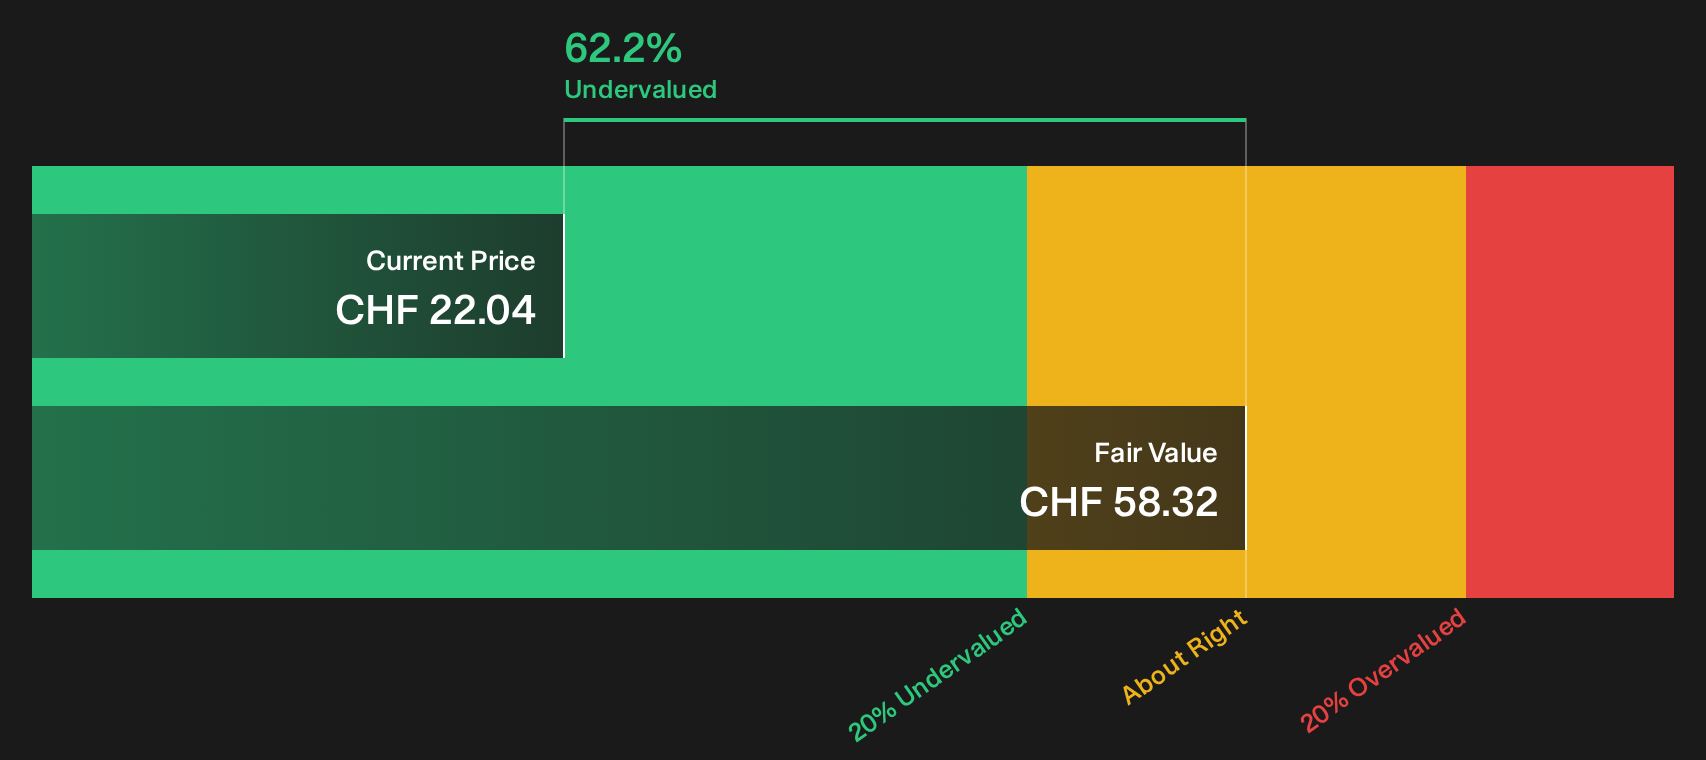
The gap between the share price and different value markers is sizeable. ams-OSRAM is flagged as trading 62.2% below an estimated fair value based on the SWS DCF model, with that future cash flow value set at CHF58.32 per share, while the stock closed at CHF22.04. That same message repeats in the preferred multiple work, where a P/S ratio of 0.7x is described as good value against the European semiconductor industry average of 4.2x, the peer average of 3.9x, and an estimated fair P/S ratio of 1.3x that the market could move towards if sentiment and fundamentals align.
Explore the SWS fair ratio for ams-OSRAM.
Result: Price-to-sales of 0.7x (UNDERVALUED)
Still, the ams-OSRAM story can be knocked off course if AI photonics demand cools or if ongoing losses strain funding for long development cycles.
Find out about the key risks to this ams-OSRAM narrative.
Another View on ams-OSRAM's Value
A second lens comes from the SWS DCF model, which pegs ams-OSRAM's future cash flow value at CHF58.32 per share versus the current CHF22.04 price. That points to a large gap that also reads as undervalued, yet it raises a key question: How comfortable are you relying on long term cash flow assumptions for a business that is still loss making?
Look into how the SWS DCF model arrives at its fair value.
Simply Wall St performs a discounted cash flow (DCF) on every stock in the world every day (check out ams-OSRAM for example). We show the entire calculation in full. You can track the result in your watchlist or portfolio and be alerted when this changes, or use our stock screener to discover 197 high quality undervalued stocks. If you save a screener we even alert you when new companies match - so you never miss a potential opportunity.
Next Steps
Mixed signals on ams-OSRAM's value story and risk profile will not resolve themselves, so move fast, test the numbers and form your own stance using the 3 key rewards and 2 important warning signs
Ready to hunt beyond ams-OSRAM?
If ams-OSRAM has sharpened your focus on opportunity and risk, broaden your watchlist now before the next wave of ideas moves without you.
- Target potential mispricing by scanning a curated set of 197 high quality undervalued stocks that combine strong fundamentals with prices that may not fully reflect their underlying strength.
- Prioritize resilience and support your peace of mind by reviewing a list of solid balance sheet and fundamentals (204 results) that can help you stress test your portfolio against tougher conditions.
- Search for potential future winners early by combing through a focused group of 620 high quality undiscovered gems before the broader market starts paying attention.
This article by Simply Wall St is general in nature. We provide commentary based on historical data and analyst forecasts only using an unbiased methodology and our articles are not intended to be financial advice. It does not constitute a recommendation to buy or sell any stock, and does not take account of your objectives, or your financial situation. We aim to bring you long-term focused analysis driven by fundamental data. Note that our analysis may not factor in the latest price-sensitive company announcements or qualitative material. Simply Wall St has no position in any stocks mentioned.
Have feedback on this article? Concerned about the content? Get in touch with us directly. Alternatively, email editorial-team@simplywallst.com