
CNA Financial (CNA) Stock Trades At A Discount To Its Equity Returns
CNA Financial has logged a solid multi year share price gain, yet the recent pullback raises a sharper question for investors. Is the current valuation really supported by the returns the insurer earns on the capital it puts to work in the business.
- Over the past 5 years the stock has delivered a total return of 56.7%, which puts real weight on whether those gains line up with the profitability of CNA Financial's capital base.
- The group relies heavily on how efficiently it converts underwriting and investment activities into profits, which can influence the pace at which it reinvests capital and the durability of its intrinsic value.
- What if you looked at CNA Financial through its earnings instead? See what CNA Financial's 10.1x P/E says about the price.
The issue now is whether the current share price is adequately explained by the returns CNA Financial earns on its capital over time.
To test whether CNA Financial's return on capital story still appeals to you, it can help to compare it with a wider set of companies screened for 32 resilient stocks with low risk scores.
Does CNA Financial Look Undervalued on Excess Returns?
The Excess Returns model looks at how effectively CNA Financial turns shareholder capital into earnings after covering a required return. It is built on the idea that consistent returns above the cost of equity can support a valuation higher than the accounting book value.
For CNA Financial, the framework uses a Book Value of $41.34 per share and a Stable EPS estimate of $4.45 per share, both anchored to the median metrics from the last 5 years. The Cost of Equity is set at $2.81 per share, which leads to an Excess Return of $1.64 per share. That implies the business is modeled to earn more on its equity base than the model treats as the shareholder hurdle, with an Average Return on Equity of 11.46% and a Stable Book Value reference of $38.82 per share. The Excess Returns projections put CNA Financial's estimated intrinsic value substantially above the current share price of $45.99, which signals that the market is not fully pricing the modeled profitability of its capital base. Find out what CNA Financial could be worth using our Excess Returns estimate.
The CNA Financial Narrative: What Would Justify Today's Price?
Simply Wall St Narratives pick up where that valuation gap for CNA Financial leaves off. They spell out which paths for growth, margins and earnings would need to play out for the stock to trade meaningfully higher or lower than today’s price, and each one treats CNA Financial's fair value as a thesis you can revisit over time rather than a single frozen snapshot.
A clear, number driven Narrative on CNA Financial gives you a single reference point for how its returns on equity, book value and earnings interact with the current share price, so your view does not just rest on the recent share price path. It also sets out explicit assumptions on where its growth, margins and execution go from here. You can then track those assumptions as future results confirm or challenge that framework.
Share your own Narrative for CNA Financial and set out the assumptions behind your valuation.
One more CNA Financial signal worth checking before you move on
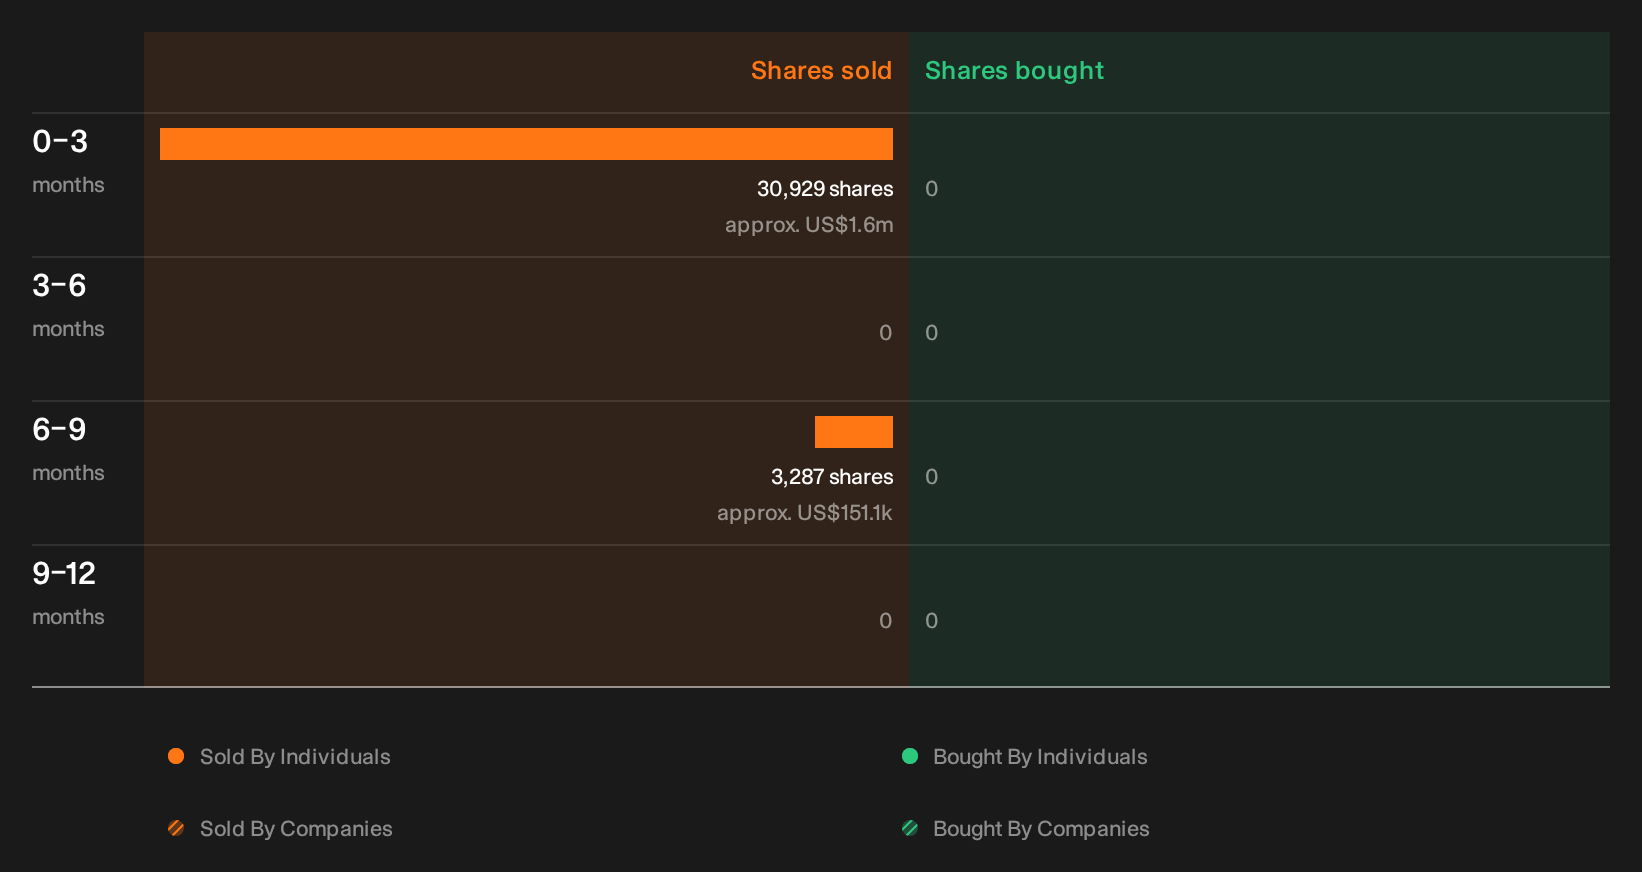
Before you file CNA Financial away based on price and returns alone, the ownership record has shown fresh selling activity from people inside the business, and the specific sellers, trade sizes and context deserve a closer look. See the recent insider selling flagged for CNA Financial.
This article by Simply Wall St is general in nature. We provide commentary based on historical data and analyst forecasts only using an unbiased methodology and our articles are not intended to be financial advice. It does not constitute a recommendation to buy or sell any stock, and does not take account of your objectives, or your financial situation. We aim to bring you long-term focused analysis driven by fundamental data. Note that our analysis may not factor in the latest price-sensitive company announcements or qualitative material. Simply Wall St has no position in any stocks mentioned.
Have feedback on this article? Concerned about the content? Get in touch with us directly. Alternatively, email editorial-team@simplywallst.com