
First Merchants (FRME) Finalized New Notes On A Valuation Story That Still Looks Open
Why First Merchants Issued New Subordinated Notes
First Merchants (FRME) has just finalized a $100 million offering of fixed to floating rate subordinated notes, a financing move that reshapes its mix of funding and regulatory capital.
The notes carry a 6.750% fixed coupon until October 1, 2031, then switch to a floating rate linked to a benchmark plus 202 basis points through maturity in 2036. For investors, that structure combines clear initial funding costs with interest payments that later track short term rates.
Recent news has landed in a stock that has been treading water in the short term but still delivering for patient holders. First Merchants’ share price is about US$40.37 after sliding about 3.7% over the past month and about 7.6% over the last quarter, yet the 1 year total shareholder return of roughly 11.9% and 3 year total shareholder return of about 64.2% point to momentum that has built over a longer stretch.
This latest subordinated notes issuance arrives shortly after a fresh shelf registration and a series of fixed income filings in September 2026. Together, these developments may be nudging the share price as investors reassess funding costs, regulatory capital flexibility and the risk profile implied by more subordinated debt in the capital stack.
Seize this chance to compare First Merchants’ capital move with a curated list of solid balance sheet and fundamentals (25 results) that also rely on disciplined funding structures and resilient financial profiles.First Merchants now has fresh subordinated debt in place and a share price that has cooled after strong multi year gains. Is most of the value already captured, or does the current valuation still leave room?
Price-to-Earnings of 13.8x: Is It Justified for First Merchants?
On simple optics, First Merchants trades on a 13.8x P/E, which screens as richer than many bank peers even with the share price at $40.37.
P/E compares what investors are paying today for each dollar of earnings. For a regional bank like First Merchants, it often reflects expectations for future profit growth, balance sheet resilience and dividend reliability more than headline revenue alone.
Here the market is assigning a higher P/E than both the US Banks industry average of 11.7x and the peer group average of 13.4x. That points to investors pricing in relatively stronger prospects or comfort with the risk profile compared with many other lenders. At the same time, Simply Wall St’s estimated fair P/E of 15.5x is higher than the current 13.8x, which suggests the market could move closer to that fair ratio level if earnings forecasts and perceived quality hold up.
Explore the SWS fair ratio for First Merchants.
Result: Price-to-Earnings of 13.8x (ABOUT RIGHT)
Still, the new subordinated notes and any shift in credit quality or loan demand for First Merchants could quickly change how comfortable investors feel with that 13.8x P/E.
Find out about the key risks to this First Merchants narrative.
Another View on First Merchants’ Value
The P/E of 13.8x paints one picture. Our DCF model tells a different story, with First Merchants trading at $40.37 versus an estimated future cash flow value of $72.87. That gap frames the stock as undervalued based on this approach. Which signal do you trust more?
Look into how the SWS DCF model arrives at its fair value.
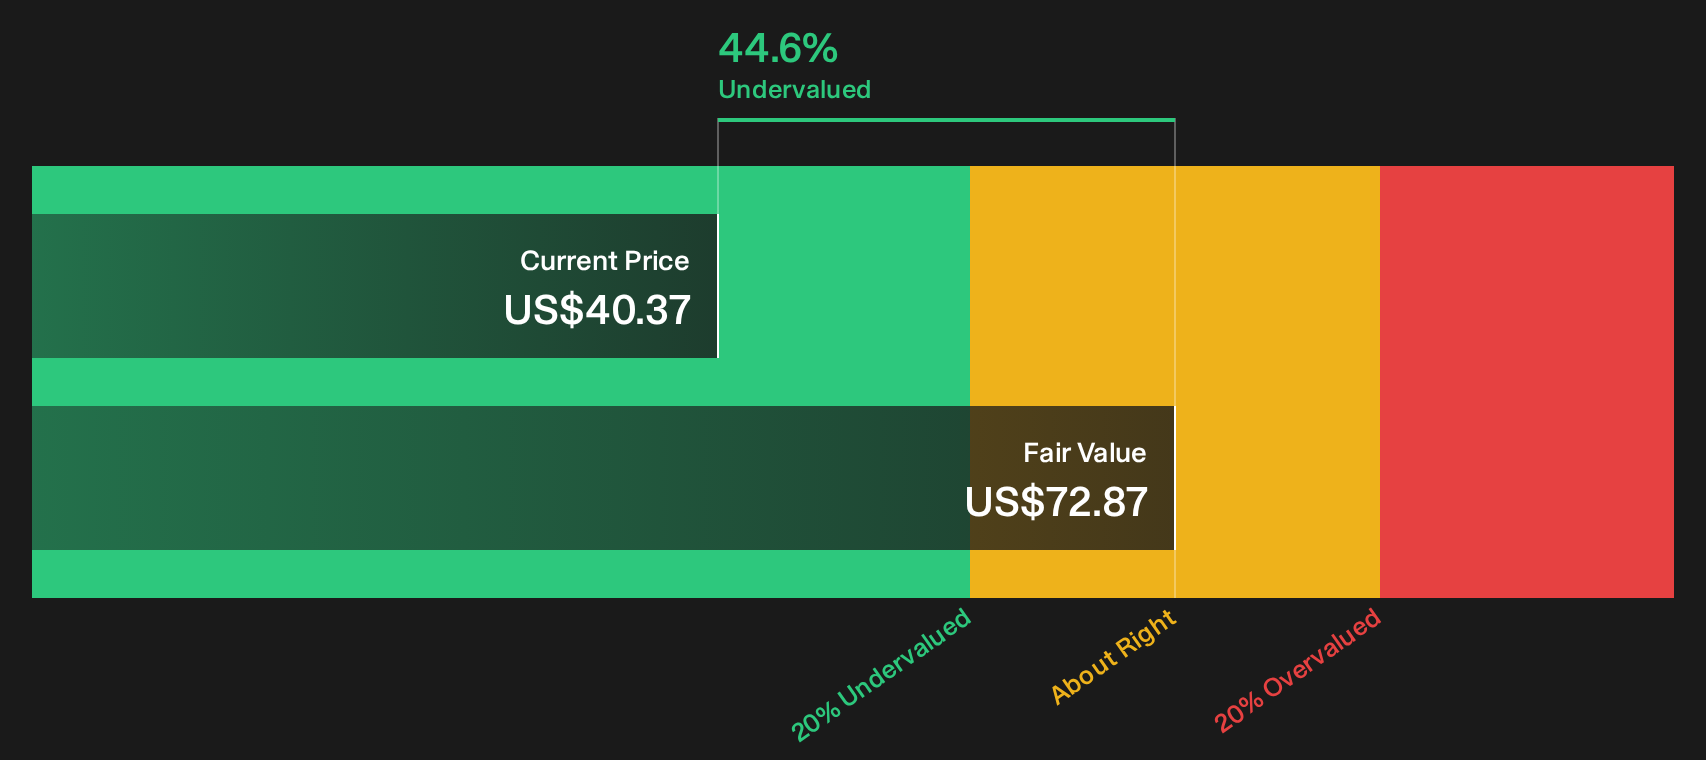
Simply Wall St performs a discounted cash flow (DCF) on every stock in the world every day (check out First Merchants for example). We show the entire calculation in full. You can track the result in your watchlist or portfolio and be alerted when this changes, or use our stock screener to discover 33 high quality undervalued stocks. If you save a screener we even alert you when new companies match - so you never miss a potential opportunity.
Next Steps
If this mix of First Merchants data leaves you torn between caution and optimism, consider reviewing the details for yourself, starting with the 3 key rewards.
Ready for more ideas beyond First Merchants?
If First Merchants has sharpened your thinking, do not stop here. Broader context across other opportunities can help you build a stronger, more resilient portfolio.
- Target potential mispricing by scanning a focused group of quality companies trading below intrinsic value through the 33 high quality undervalued stocks.
- Build a steadier income stream by reviewing a curated set of higher yielding payers with the 6 dividend fortresses.
- Strengthen your downside protection by filtering for companies with robust finances using the 30 resilient stocks with low risk scores.
This article by Simply Wall St is general in nature. We provide commentary based on historical data and analyst forecasts only using an unbiased methodology and our articles are not intended to be financial advice. It does not constitute a recommendation to buy or sell any stock, and does not take account of your objectives, or your financial situation. We aim to bring you long-term focused analysis driven by fundamental data. Note that our analysis may not factor in the latest price-sensitive company announcements or qualitative material. Simply Wall St has no position in any stocks mentioned.
Have feedback on this article? Concerned about the content? Get in touch with us directly. Alternatively, email editorial-team@simplywallst.com