
Why General American Investors Company (GAM) Is Back In The Spotlight
General American Investors Company (GAM) has drawn attention after recent price moves left the closed end fund trading with an intrinsic discount of about 55%, putting the current market value well below its assessed worth.
Recent trading paints a mixed picture for General American Investors Company. The share price return is up 2.23% over 90 days and 9.69% year to date, while the 1-year total shareholder return of 16.31% and 3-year total shareholder return of about 2x suggest longer term momentum has been much stronger than in the latest month, when the share price return declined 3.93% as investors reassessed both upside potential and fund specific risk around that wide discount.
Scan other deep value plays trading at wide discounts alongside General American Investors Company by running the curated 32 high quality undervalued stocks.
General American Investors Company looks like a seasoned, research driven fund, yet the market is pricing its shares at a steep discount after the recent pullback. Is that gap a sensible warning sign or a valuation anomaly?
Price-to-Earnings of 4.2x: Is it justified?
On simple earnings terms, General American Investors Company looks inexpensive, with a P/E of 4.2x against a share price of $64.52 and a reported earnings growth figure that is far from sluggish.
The P/E multiple tells you how many dollars investors are willing to pay today for each dollar of recent profit. For an investment manager like General American Investors Company, this measure often reflects how sustainable those earnings are and how much confidence the market has in the underlying portfolio and fee stream.
Recent numbers show earnings up 91.8% over the past year and a 5 year earnings growth rate of 17.2% per year, although management has flagged a large one off gain of $377.9m that affects the latest results. This may be one reason why the market is not assigning a richer P/E. Even after allowing for that, the current 4.2x multiple is far below both the US Capital Markets industry average P/E of 39.4x and the peer group average of 14x. This points to a market that is pricing in either significant caution around the quality of those profits or a meaningful degree of skepticism about how repeatable they are.
Result: Price-to-Earnings of 4.2x (UNDERVALUED).
See what the numbers say about this price — find out in our valuation breakdown.
Still, the heavy reliance on a single year, boosted by a $377.9m gain, and the wide discount to intrinsic value both leave room for sentiment to turn quickly.
Find out about the key risks to this General American Investors Company narrative.
Another View on General American Investors Company's Value
The SWS DCF model points in the same direction as the low P/E. At a share price of $64.52 and an estimated future cash flow value of $144.13, the framework suggests General American Investors Company trades at a big markdown. If both earnings and cash flow signals agree, what is the market still worried about?
Look into how the SWS DCF model arrives at its fair value.
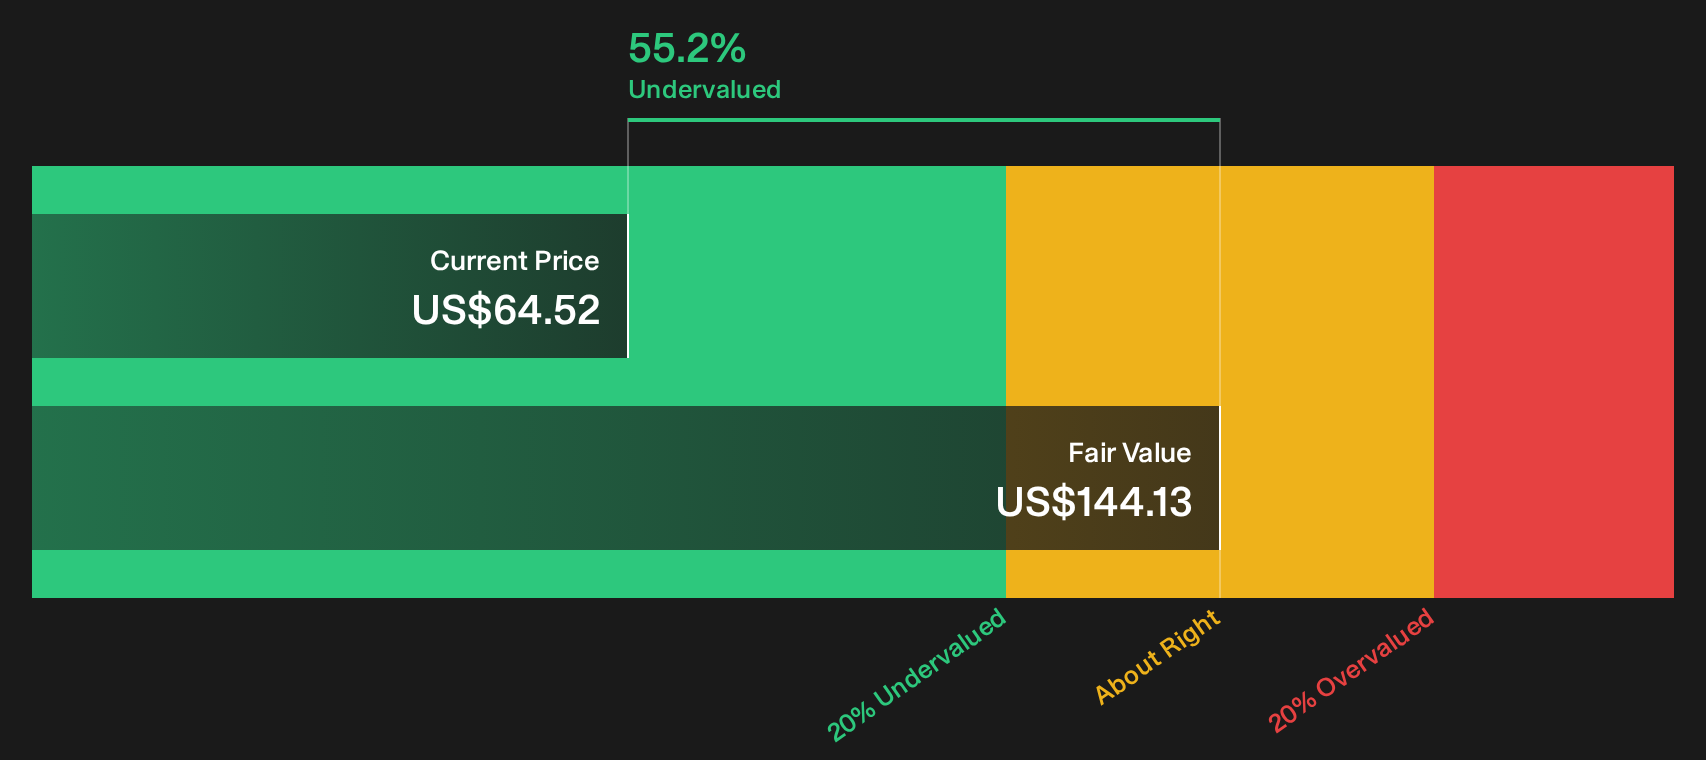
Simply Wall St performs a discounted cash flow (DCF) on every stock in the world every day (check out General American Investors Company for example). We show the entire calculation in full. You can track the result in your watchlist or portfolio and be alerted when this changes, or use our stock screener to discover 32 high quality undervalued stocks. If you save a screener we even alert you when new companies match - so you never miss a potential opportunity.
Next Steps
Curious whether the market has General American Investors Company right or wrong at this discount and P/E level? Act quickly, review the same data, and weigh both the potential upside and the flagged concerns using the 2 key rewards and 2 important warning signs.
Looking for more investment ideas beyond General American Investors Company?
Do not stop with General American Investors Company at this discount. Use the same disciplined lens across the market and let structured screens surface opportunities you might otherwise miss.
- Spot potential mispriced opportunities early by scanning the 16 high quality undiscovered gems before wider attention affects valuations.
- Prioritise stability and capital protection by reviewing the 30 resilient stocks with low risk scores so you focus on businesses with more resilient risk profiles.
- Zero in on companies with robust financial footing by checking the list of solid balance sheet and fundamentals (24 results) while others chase stories that lack balance sheet strength.
This article by Simply Wall St is general in nature. We provide commentary based on historical data and analyst forecasts only using an unbiased methodology and our articles are not intended to be financial advice. It does not constitute a recommendation to buy or sell any stock, and does not take account of your objectives, or your financial situation. We aim to bring you long-term focused analysis driven by fundamental data. Note that our analysis may not factor in the latest price-sensitive company announcements or qualitative material. Simply Wall St has no position in any stocks mentioned.
Have feedback on this article? Concerned about the content? Get in touch with us directly. Alternatively, email editorial-team@simplywallst.com