
UK Income Stocks Facing A Gilt Yield Test
UK gilt yields are back in the spotlight as higher debt, rising interest costs and talk of extra taxes put a fresh question mark over the appeal of income stocks. That shift can quickly change how investors value dividends, which creates both risk and opportunity. This article walks through three large cap UK companies exposed to this story and explains where their income profiles may look more or less resilient.
The three stocks below are just a starting sample of UK income-oriented large caps, and the full screen surfaced 16 more companies with equally detailed dividend stories and gilt yield sensitivity profiles that are not covered here. If you want to identify and analyze the higher conviction ideas straight away, head into the UK Income-Oriented Large-Cap Stocks Sensitive to Gilt Yields screener.
Schroder Real Estate Investment Trust (LSE:SREI)
Overview: Schroder Real Estate Investment Trust owns a diversified UK commercial property portfolio and focuses on paying income to shareholders.
Operations: Schroder Real Estate Investment Trust generates £31 million of revenue from property investment in the United Kingdom.
Market Cap: £201 million
Schroder Real Estate Investment Trust gives you pure UK property exposure, with 37 buildings, £29 million of rent and a REIT structure geared to distributions that compete directly with gilts. Income investors may note the wide discount to estimated value, alongside an unresolved pressure that could influence future payout capacity.
That unresolved pressure is exactly why many investors are now scanning the 1 key reward and 4 important warning signs (2 are major!) to see how the income story could shift from here.
AEW UK REIT (LSE:AEWU)
Overview: AEW UK REIT owns a portfolio of smaller UK commercial properties, targeting high income streams that compete directly with gilt yields.
Operations: AEW UK REIT generates about £23 million from investment in UK commercial property and property related assets, entirely within the United Kingdom.
Market Cap: £163 million
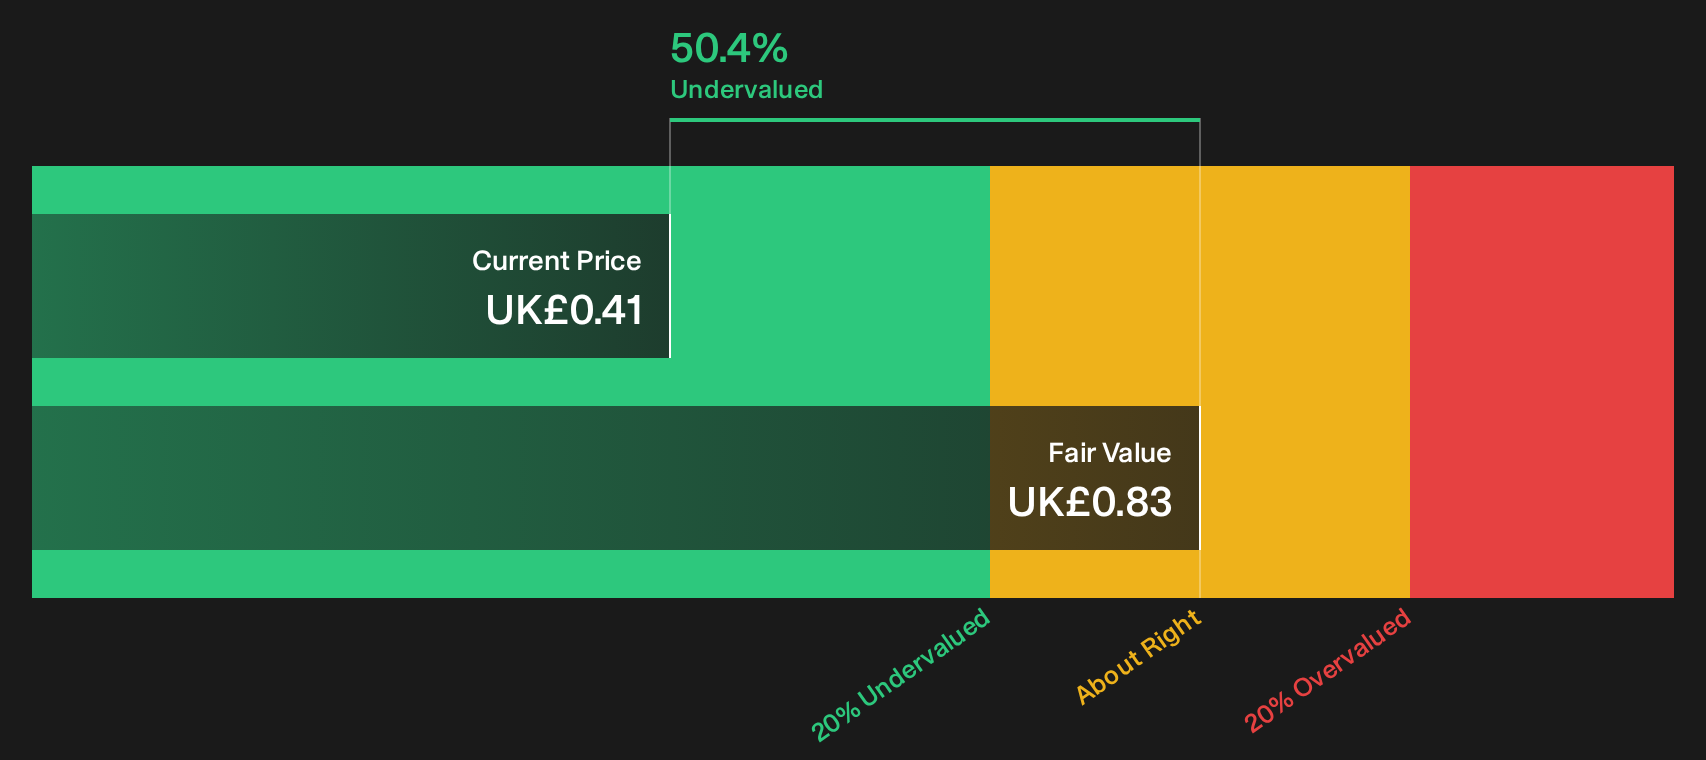
AEW UK REIT sits squarely in this screener as a high yield, UK listed property vehicle. Its pricing tends to move with gilt yields, yet its recent dividend wobble and earnings decline mean income investors are weighing an attractive payout stream against what can happen when an unseen pressure on funding costs and property values shifts again.
That kind of wobble makes it worth pulling up the 1 key reward and 4 important warning signs (1 is major!) to see how AEW UK REIT’s yield profile and risk trade off from here.

Regional REIT (LSE:RGL)
Overview: Regional REIT is a UK focused commercial property trust that owns and actively manages income producing offices and other assets outside the M25.
Operations: Regional REIT generates about £73 million in commercial REIT income entirely from UK properties, reflecting a single country revenue base.
Market Cap: £145 million
Regional REIT matters in this gilt sensitive income screen because its regional office rents, funding costs and dividend profile all react when UK rates and government bond markets move.
"Ongoing investment in EPC A and B compliant refurbishments, with clear evidence of rental uplifts and valuation gains on completed projects, is likely to widen the gap between achieved rents and historic ERVs."
What happens when one unseen pressure in that equation shifts will decide how much of the income story reaches shareholders.
When that pressure shifts again, read the full narrative for Regional REIT to see how Regional REIT’s income story could accelerate, stall, or quietly decouple from gilt moves.

Seeking Fresh Alternatives Beyond Gilts
Fresh opportunities can move from quiet to flying once momentum builds and dividend stories shift. Screen for potential breakouts before the crowd, while it matters, and get in early.
- Target steadier portfolio anchors by scanning a curated 4 resilient stocks with low risk scores that aim to hold up when sentiment swings and capital gets more selective.
- Hunt for income streams that could outlast short term rate moves by reviewing a focused 1 dividend fortresses curated for yield plus balance sheet strength.
- Track where capital might rotate next by checking a hand picked 10 high quality undervalued stocks that blends cash flow quality with compressed expectations.
This article by Simply Wall St is general in nature. We provide commentary based on historical data and analyst forecasts only using an unbiased methodology and our articles are not intended to be financial advice. It does not constitute a recommendation to buy or sell any stock, and does not take account of your objectives, or your financial situation. We aim to bring you long-term focused analysis driven by fundamental data. Note that our analysis may not factor in the latest price-sensitive company announcements or qualitative material. Simply Wall St has no position in any stocks mentioned.
Have feedback on this article? Concerned about the content? Get in touch with us directly. Alternatively, email editorial-team@simplywallst.com