
Arxis (ARXS) Enters S&P Defense Index After Rally While Valuation Questions Linger
Arxis (ARXS) just picked up a new spotlight as it joined the S&P Aerospace & Defense Select Industry Index, shortly after confirming plans to present at Morgan Stanley’s upcoming Laguna investor conference.
Recent index inclusion and the upcoming conference slot come after a 90 day share price return of 15.6% and a year to date share price return of 32.0%. However, the 30 day share price return declined 3.6%, indicating that Arxis has shown stronger performance over the longer term while easing slightly in the past month.
Scan how Arxis compares within aerospace and defense by reviewing the hand picked 31 resilient stocks with low risk scores that match a similar mission critical profile.
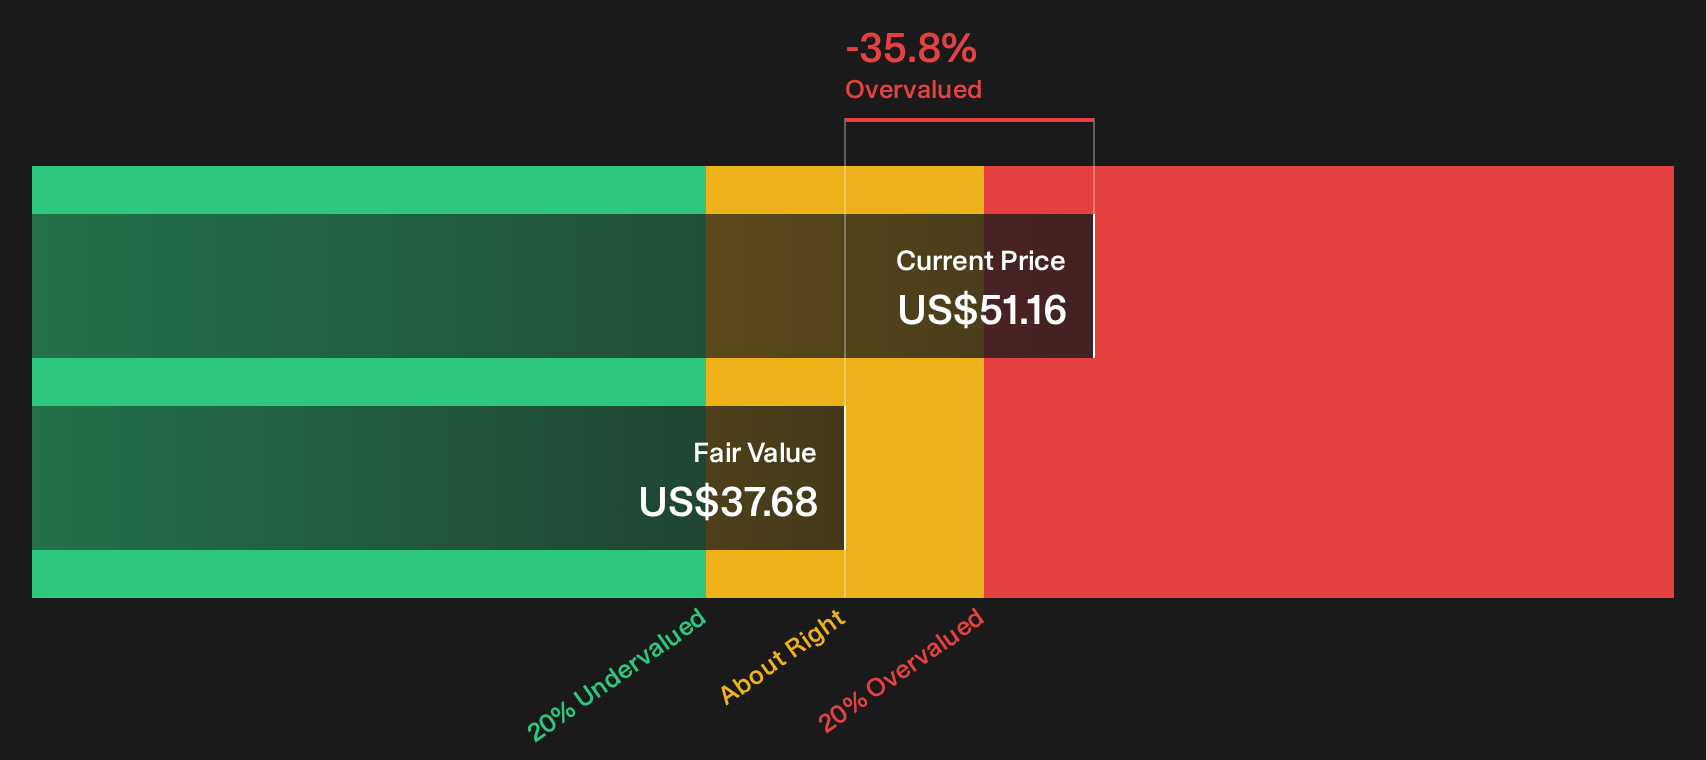
After a 32.0% year to date climb and a recent pullback, Arxis now trades about 21% below the average analyst target and sits above one intrinsic estimate that implies a 35.8% premium. Which anchor appears closer to fair value?
Preferred Price-to-Sales Multiple of 12.5x for Arxis: Is it justified?
On simple sales based metrics, Arxis carries a rich tag. The stock trades on a P/S ratio of 12.5x, while the broader US Aerospace & Defense group sits at 4.1x and its closer peer set averages 5.8x.
P/S compares the company value that the market is placing on Arxis to its annual revenue of $1.77b. For a supplier of mission critical electronic and mechanical components, investors often watch this gauge to see how much they are paying for each dollar of top line when earnings history is still relatively short and the business only recently moved into profit.
The valuation gap is wide. Against both peers at 5.8x and the industry at 4.1x, Arxis trades on more than double those reference points, which indicates the market is paying a premium relative to comparable aerospace and defense businesses.
See what the numbers say about this price — find out in our valuation breakdown.
Result: Price-to-sales of 12.5x (OVERVALUED).
Still, Arxis faces clear pressure points, including any slowdown in defense or semiconductor testing demand, as well as the risk that rich P/S expectations prove too optimistic.
Find out about the key risks to this Arxis narrative.
Another View on Arxis Using Our DCF Model
There is a different signal when looking at Arxis through the SWS DCF model. On this measure, the stock price of $51.16 sits above an estimated future cash flow value of $37.68, which points to an overvalued result instead of a potential bargain. Which lens would you lean on when those messages conflict?
Look into how the SWS DCF model arrives at its fair value.
Simply Wall St performs a discounted cash flow (DCF) on every stock in the world every day (check out Arxis for example). We show the entire calculation in full. You can track the result in your watchlist or portfolio and be alerted when this changes, or use our stock screener to discover 30 high quality undervalued stocks. If you save a screener we even alert you when new companies match - so you never miss a potential opportunity.
Next Steps
Mixed signals around Arxis so far. If you want to move quickly and decide where you stand, start with the 3 key rewards and 1 important warning sign.
Looking for more Arxis sized investment ideas?
Ready to widen the opportunity set beyond Arxis and spot your next move faster? Put a few focused screens to work so you are not leaving potential ideas on the table.
- Target resilient balance sheets first by filtering for companies on the list of solid balance sheet and fundamentals (23 results) that can better handle shocks when conditions change.
- Hunt for mispriced quality by scanning the 30 high quality undervalued stocks and comparing businesses trading below what their fundamentals might justify.
- Lock in cash flow focus by reviewing the 7 dividend fortresses and focusing on companies offering higher yields with income as a core feature.
This article by Simply Wall St is general in nature. We provide commentary based on historical data and analyst forecasts only using an unbiased methodology and our articles are not intended to be financial advice. It does not constitute a recommendation to buy or sell any stock, and does not take account of your objectives, or your financial situation. We aim to bring you long-term focused analysis driven by fundamental data. Note that our analysis may not factor in the latest price-sensitive company announcements or qualitative material. Simply Wall St has no position in any stocks mentioned.
Have feedback on this article? Concerned about the content? Get in touch with us directly. Alternatively, email editorial-team@simplywallst.com