
Is Jackson Financial (JXN) Undervalued After Its Strong Long Term Return Run?
Jackson Financial stock triggered by long term return profile
Jackson Financial (JXN) is back on investor radars after fresh data highlighted its very strong five year total return record, turning a once quiet annuity specialist into a case study in compounding.
Recent trading has been choppy, with a 1-week share price return of 5.38% down and a 30-day share price return of 1.96% lower, even as Jackson Financial still shows a 90-day share price return of 21.88% and a one year total shareholder return of 30.97%. This points to momentum that has cooled in the short term but remains very strong over a multi year horizon.
Scan beyond Jackson Financial and look for other insurance and financials plays with powerful multi year return profiles using the curated 30 high quality undervalued stocks.
After a sharp multi year run and a recent pullback, Jackson Financial now sits at a point where the key issue is simple: Does the current valuation still offer more upside than risk for new money stepping in here?
Most Popular Narrative: 11% Undervalued
Jackson Financial closed at $129.73, while the most followed narrative anchors on a fair value of $146 based on modeled cash flows and profitability. That gap frames the current debate around whether long term return potential still compensates for the complexity in its annuity and hedging profile.
The strategic shift toward greater product diversification, especially fee-based and spread products like RILA and fixed annuities, is expanding Jackson's margins, reducing earnings volatility, and positioning the company to benefit from long-term trends in defined contribution retirement plans positively impacting net margins and overall profitability.
See why 21 investors see Jackson Financial as 11% undervalued.
Result: Fair Value of $146 (UNDERVALUED)
Still, the narrative around Jackson Financial could be knocked off course if issues related to variable annuity hedging or captive reinsurers materially pressure capital and reported earnings quality.
Find out about the key risks to this Jackson Financial narrative.
Another View on Jackson Financial valuation
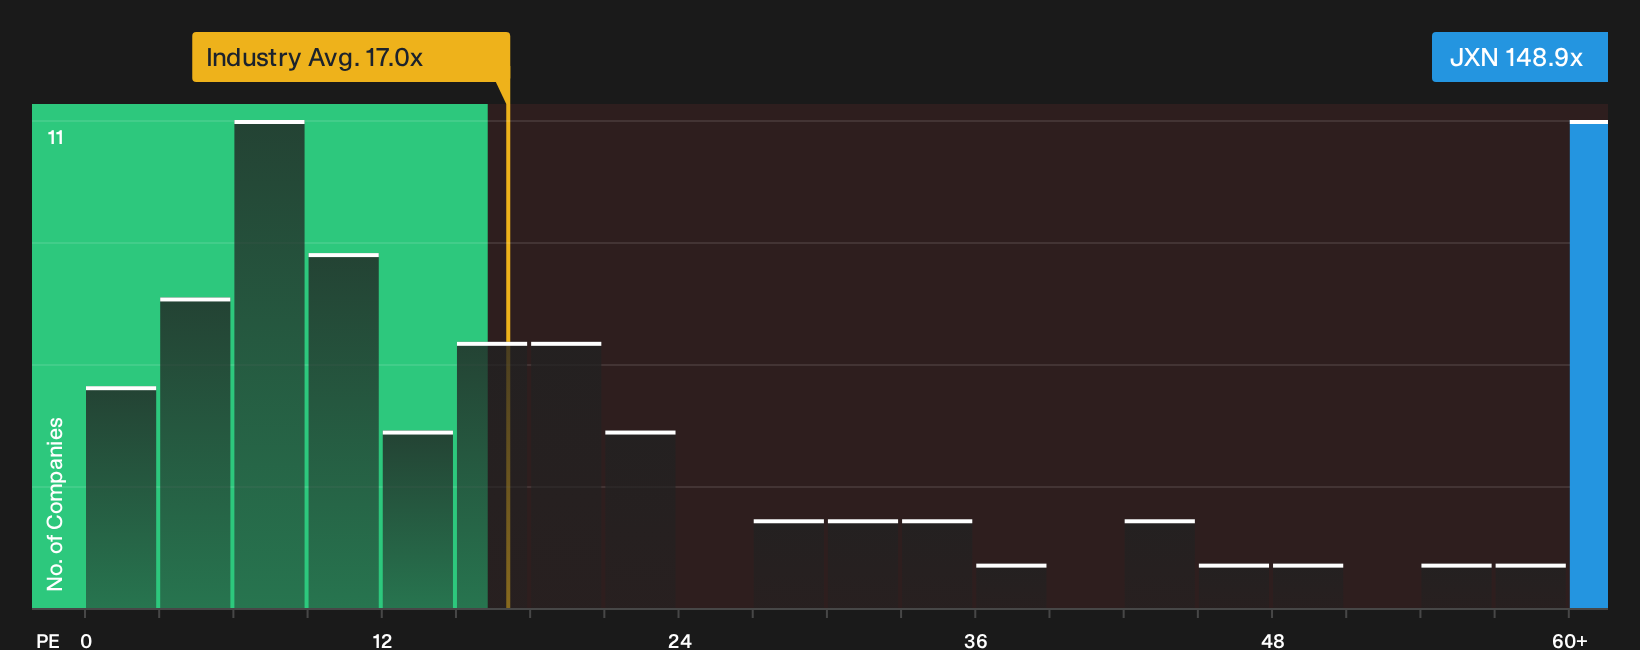
There is a wrinkle in the Jackson Financial story. On simple P/E, the stock trades at 148.9x, which is far richer than peers at 25x, the US Diversified Financial industry at 17.1x, and even an estimated fair ratio of 23.4x. That gap points to meaningful valuation risk if expectations reset.
Investors now have two very different signals on Jackson Financial, one from cash flow based work and one from earnings multiples, so which yardstick should carry more weight for you?
See what the numbers say about this price — find out in our valuation breakdown.
Next Steps
Mixed messages in the Jackson Financial story so far. Consider the current sentiment carefully and weigh the upside against the weak spots with 2 key rewards and 2 important warning signs.
Looking for more investment ideas beyond Jackson Financial?
If Jackson Financial has sharpened your focus on long term returns, do not stop here. Broaden your watchlist and pressure test your next moves using fresh idea lists.
Use the Simply Wall St Screener to surface three very different sets of opportunities that could complement or contrast what you see in Jackson Financial.
- Target income today and resilience over cycles by scanning companies that show up as potential 7 dividend fortresses.
- Hunt for strong fundamentals and robust balance sheets that can support future decisions by filtering through the list of solid balance sheet and fundamentals (23 results).
- Spot potential future leaders before they appear on everyone else's radar by working through the 16 high quality undiscovered gems.
This article by Simply Wall St is general in nature. We provide commentary based on historical data and analyst forecasts only using an unbiased methodology and our articles are not intended to be financial advice. It does not constitute a recommendation to buy or sell any stock, and does not take account of your objectives, or your financial situation. We aim to bring you long-term focused analysis driven by fundamental data. Note that our analysis may not factor in the latest price-sensitive company announcements or qualitative material. Simply Wall St has no position in any stocks mentioned.
Have feedback on this article? Concerned about the content? Get in touch with us directly. Alternatively, email editorial-team@simplywallst.com