
CK Asset (SEHK:1113) Stock Stays Near Fair Value After A 34% Run
CK Asset Holdings has delivered a 3 year share price return that long term holders will notice, yet the question for anyone looking at the stock today is whether that move is backed up by the earnings power of the business. With the shares recently changing hands at HK$46.18, the real issue is how that price lines up with what its profits can reasonably support.
- Over the past 3 years the stock has returned 34.3%, which puts real weight on whether the current market value still reflects what its earnings profile can justify.
- The group’s model as a large asset owner and developer means future income often depends on how effectively it turns its portfolio into recurring earnings and cash, which can shape how much investors are prepared to pay for each dollar of profit.
- There is a second opinion on CK Asset Holdings worth weighing. See what analysts think CK Asset Holdings's shares could be worth.
The stock’s next move may depend on whether CK Asset Holdings’ current price can be squared with its earnings using that lens.
If you want extra context on whether CK Asset Holdings' 3 year return looks compelling for an earnings focused idea, compare it with companies in the 174 high quality undervalued stocks
Where Does CK Asset Holdings Sit on Earnings?
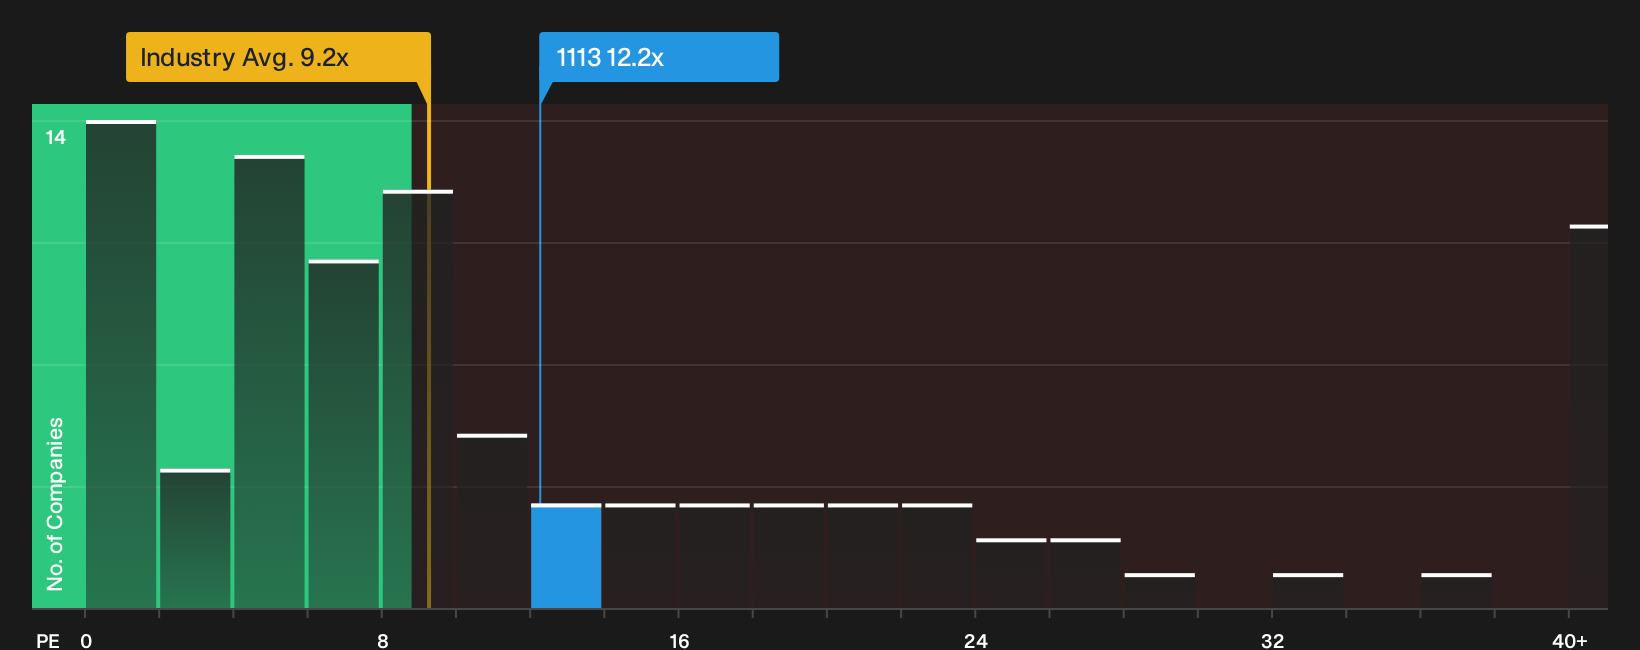
The P/E ratio is a useful yardstick for CK Asset Holdings because it links what you pay today with the earnings that already exist. On this measure, the stock trades at about 12.2x earnings, which is below both the real estate sector average of roughly 9.2x and the peer group average of about 14.5x. That tells you the market is valuing each dollar of CK Asset Holdings’ profit at a level that sits between broader sector pricing and closer peers.
A model based fair multiple, which blends factors like margins, growth expectations, size and risk profile, points to a level not far from where the shares currently change hands. The present P/E sits close to that mark rather than clearly above or below it, so the ratio alone does not flag CK Asset Holdings as obviously overvalued or clearly undervalued. It leaves the weight on how you view the resilience and quality of its earnings stream. Explore the numbers behind CK Asset Holdings's P/E valuation.
The CK Asset Holdings Narrative: What Would Justify Today's Price?
Simply Wall St Narratives for CK Asset Holdings pick up where the P/E discussion leaves off and explain which combinations of future growth, margins and earnings power would need to occur for the shares to appear meaningfully higher or lower than today’s price. Each narrative sets out a fair value as a thesis about CK Asset Holdings' business that you can track over time, and they appear on Simply Wall St’s Community page.
Community views on CK Asset Holdings split between those who see more upside in the current setup and others who think caution is warranted.
Bull case: 14% undervalued
"CK Asset's increasing mix of recurring income (81% of revenue and 83% of profit are now recurring), anchored in rental properties, infrastructure, utilities, and pub operations, underpins steady net margins and provides a foundation for stable or rising dividend payouts..."
Discover why this Narrative puts CK Asset Holdings at 14% undervalued.
Bear case: roughly fairly valued
"High vacancies and oversupply in Hong Kong's commercial office segment, with Cheung Kong Center I occupancy at only 75% and Cheung Kong Center II lagging further, signal lower rental income growth and ongoing risk of fair value impairments to the investment property portfolio..."
Explore why this Narrative puts CK Asset Holdings at roughly fairly valued.
One more CK Asset Holdings check before you lean on the valuation
Price and earnings only tell part of the story for CK Asset Holdings, because separate checks have flagged specific areas of concern that deserve your attention before you lean on any conclusion. Take a closer look at 1 warning sign before settling on a valuation.
This article by Simply Wall St is general in nature. We provide commentary based on historical data and analyst forecasts only using an unbiased methodology and our articles are not intended to be financial advice. It does not constitute a recommendation to buy or sell any stock, and does not take account of your objectives, or your financial situation. We aim to bring you long-term focused analysis driven by fundamental data. Note that our analysis may not factor in the latest price-sensitive company announcements or qualitative material. Simply Wall St has no position in any stocks mentioned.
Have feedback on this article? Concerned about the content? Get in touch with us directly. Alternatively, email editorial-team@simplywallst.com