
How Investors May Respond To THOR Industries (THO) Revenue Holds As Margins Tighten
- THOR Industries reported fourth quarter 2026 sales of US$2.31b and net income of US$40.84m, with full year revenue of US$9.61b and profit of US$177.54m, while earnings per share were lower than the prior year.
- Management pointed to weaker North American demand, higher material costs and product mix pressure, while European operations and cost initiatives helped support overall performance.
- Now the focus turns to how THOR Industries' mixed earnings, particularly the pressure on margins, may influence the wider investment narrative.
What Is THOR Industries' Investment Narrative?
To own THOR Industries, you need to be comfortable with a cyclical, capital intensive manufacturer that lives and dies by big ticket consumer demand. The latest quarter underlined that reality. Revenue held up better than earnings, margins stayed under pressure, and North American softness offset more resilient European performance. Management is leaning on cost initiatives, an evolving North American RV operating model and brand breadth to keep plants utilized and pricing disciplined. Those moves, plus share repurchases and debt reduction, suggest a focus on shoring up the equity story rather than chasing volume at any price.
In the short term, the key swing factors are still retail demand into the next selling season, how quickly material and promotional costs settle, and whether the new leadership structure in North American RVs can translate into cleaner execution. The recent results and commentary around weaker show traffic and affordability concerns keep that demand question very live. At the same time, THOR Industries carries a P/E above both global auto and peer averages, with net margins that are currently thinner than last year, so believers are effectively backing the earnings recovery and the durability of its dividend rather than a bargain multiple.
Even so, there is a structural issue in the background that could complicate that recovery story if ...
There's only one way to know the right time to buy, sell or hold THOR Industries. Head to Simply Wall St's company report for the latest analysis of THOR Industries's Fair Value.
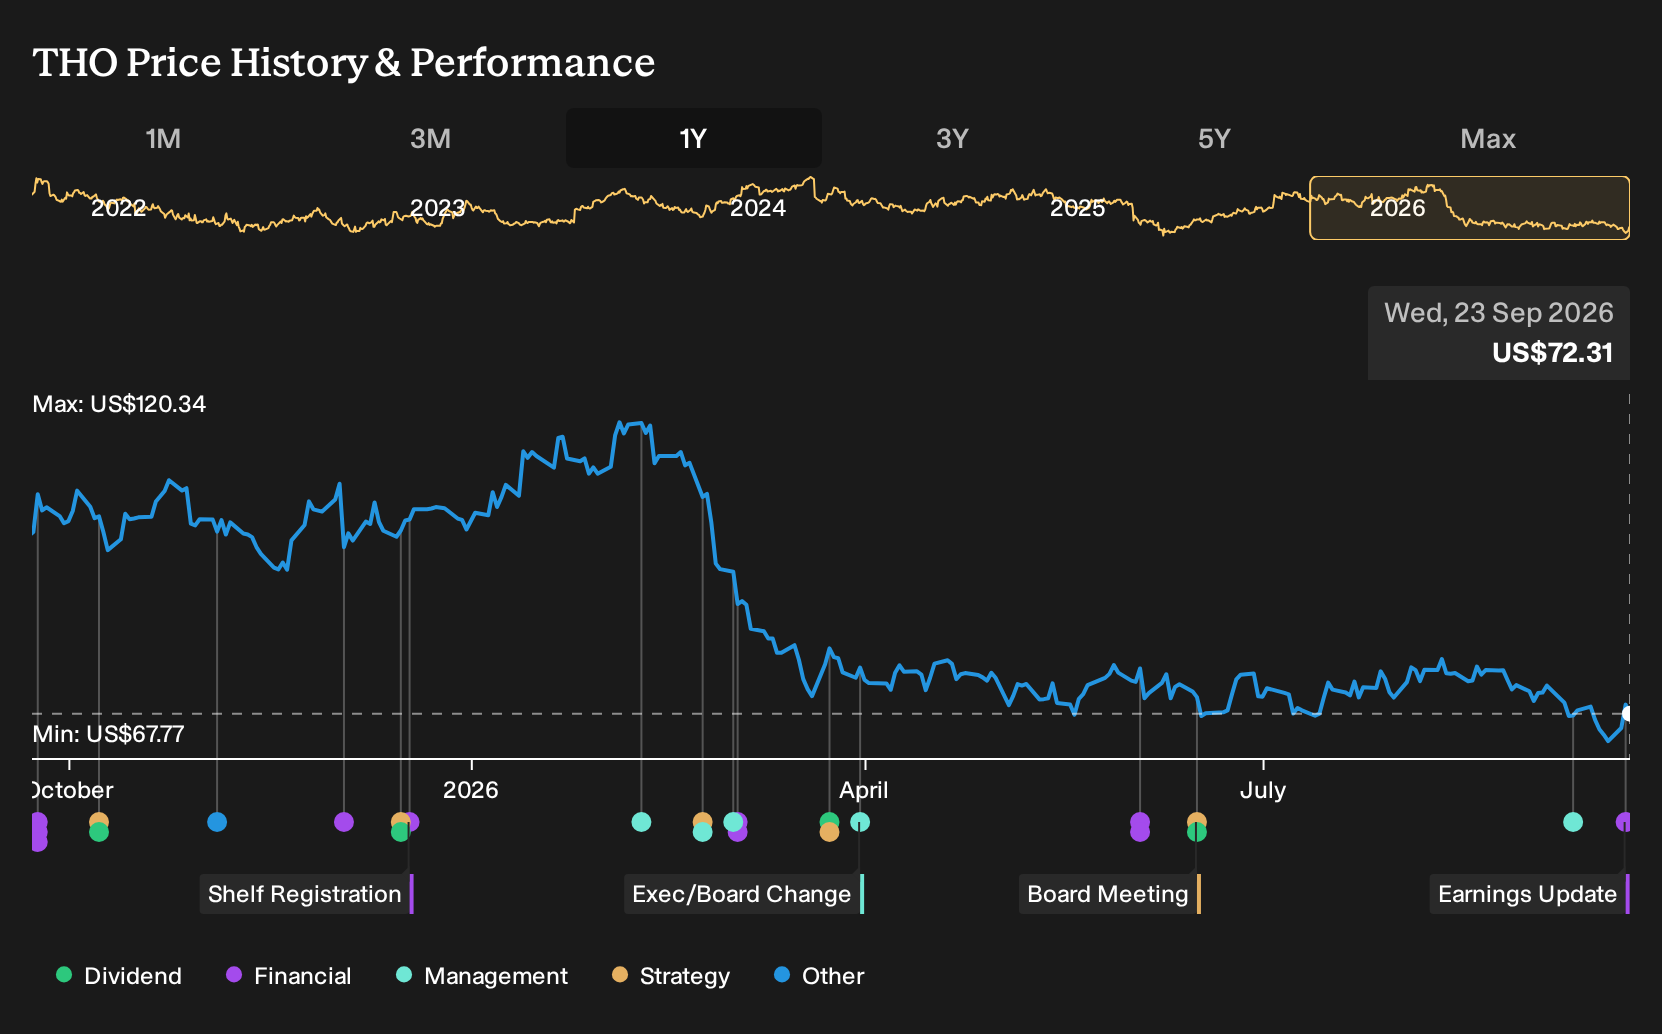
Exploring Other Perspectives
Fair value estimates for THOR Industries from the Simply Wall St Community span roughly US$27.84 to US$84.91 across just three individual assessments, so you are looking at a very wide spread from a small sample of private investors. That diversity sits beside fresh earnings pressure and leadership changes. Together, these factors invite you to compare multiple viewpoints before leaning on any single fair value line.
Explore 2 other THOR Industries fair value estimates, including one that suggests up to 17% upside from the current price.
The Verdict Is Yours
Disagree with this assessment? Extraordinary investment returns rarely come from following the herd, so go with your instincts.
- A great starting point for your THOR Industries research is our analysis highlighting 2 key rewards and 1 important warning sign that could impact your investment decision.
- See our latest analysis for THOR Industries. The report includes a comprehensive fundamental analysis summarized in a single visual, the Snowflake, making it easy to evaluate THOR Industries' overall financial health at a glance.
Looking For More Ideas Beyond THOR Industries?
If THOR Industries' latest results have you rethinking how you spread risk and opportunity, casting the net wider with a targeted screener can help you pressure test your current watchlist and spot gaps you might have missed.
- For investors who want quality with a margin of safety, start by scanning 30 high quality undervalued stocks that pair stronger fundamentals with prices that look more conservative.
- If durable income is your priority, filter for 7 dividend fortresses that combine higher yields with more robust payout profiles.
- To lean into resilience when conditions get tougher, focus on a 31 resilient stocks with low risk scores that flags businesses with more stable risk scores and fewer financial weak spots.
This article by Simply Wall St is general in nature. We provide commentary based on historical data and analyst forecasts only using an unbiased methodology and our articles are not intended to be financial advice. It does not constitute a recommendation to buy or sell any stock, and does not take account of your objectives, or your financial situation. We aim to bring you long-term focused analysis driven by fundamental data. Note that our analysis may not factor in the latest price-sensitive company announcements or qualitative material. Simply Wall St has no position in any stocks mentioned.
Have feedback on this article? Concerned about the content? Get in touch with us directly. Alternatively, email editorial-team@simplywallst.com