
Is Premier Investments (ASX:PMV) Undervalued On Weaker Full Year Results?
Premier Investments (ASX:PMV) has drawn fresh attention after releasing full year results to 25 July 2026, with sales, revenue and net income all lower than the prior year.
The reaction has been harsh. Premier Investments’ share price is down about 24.5% over the past 90 days and roughly 19.3% year to date, while the 1 year total shareholder return has fallen about 41.4%. This points to fading momentum as investors reassess earnings risk.
Broaden your watchlist beyond Premier Investments and scan a hand-picked 6 high quality undervalued stocks that currently trade at what our models flag as potentially attractive valuations.
Premier Investments now trades at a sizeable discount to both analyst targets and some fair value estimates after that sharp slide. Is the market simply pricing in weaker earnings, or has caution swung too far?
Preferred P/E of 12.3x: Is it justified?
Premier Investments now trades on a P/E of 12.3x, which is paired with a share price of A$11.16 that sits well below several valuation markers flagged in the data.
The P/E ratio compares the current share price to earnings per share and gives a quick sense of how much you are paying for each dollar of profit. For a retailer like Premier Investments, this is a common yardstick because profits can be cyclical, and investors often focus on how resilient those earnings look through different trading conditions.
Here, the 12.3x P/E looks low relative to a few anchors in the dataset. It sits beneath the Oceanic specialty retail industry average of 15.9x and also below the peer average of 22.3x. This points to a material gap in how the market is valuing Premier Investments compared with similar stocks. The estimated fair P/E of 15.5x is also higher than the current multiple, which suggests a level investors could focus on if sentiment or earnings expectations shift.
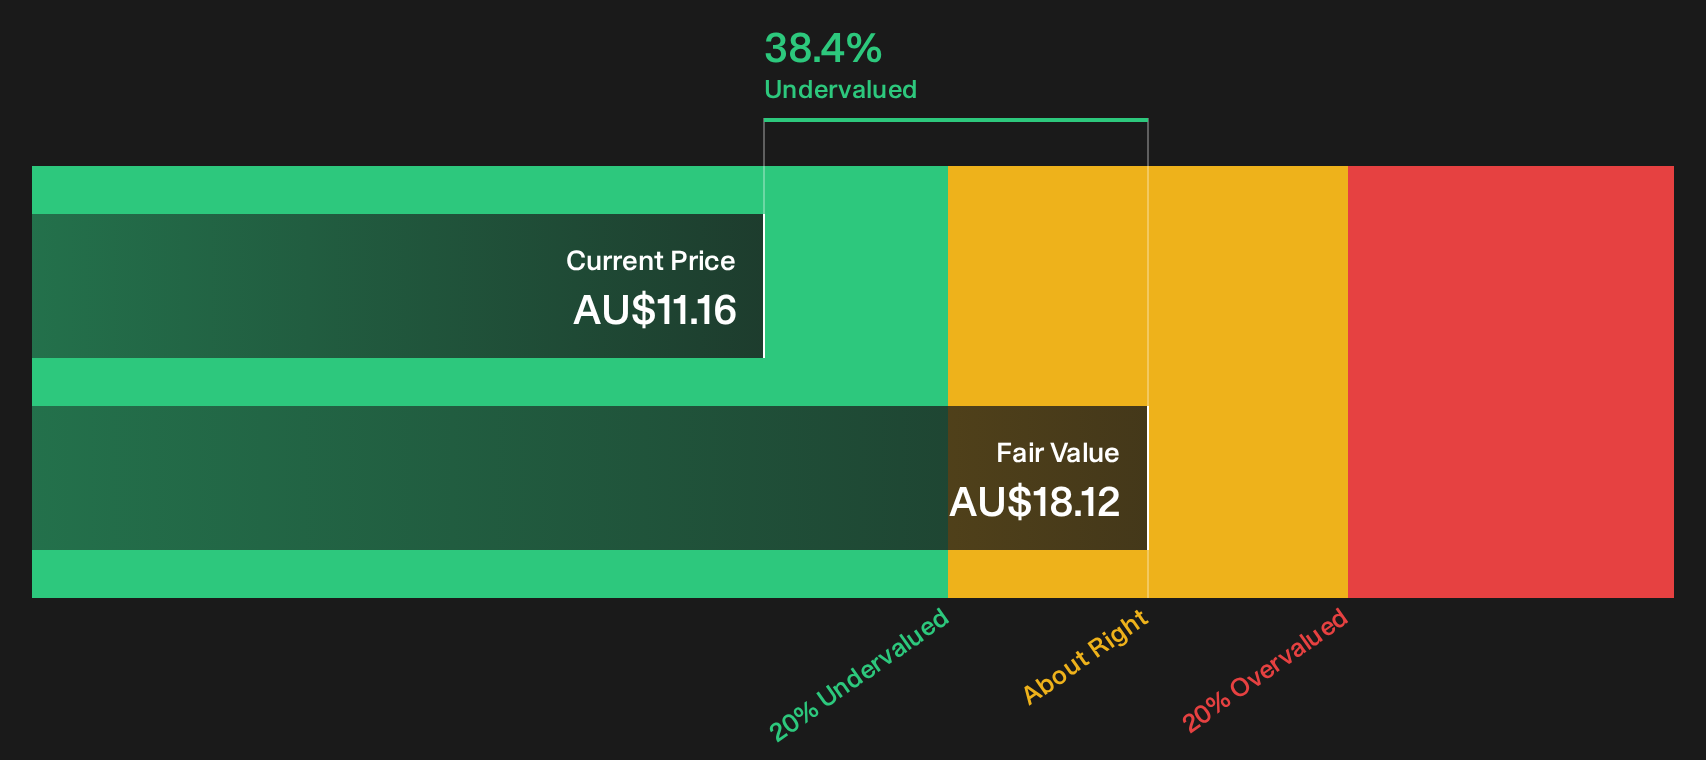
The contrast between the current P/E and those reference points is stark. It adds context to Premier Investments trading at 38.4% below one fair value estimate and at a 40.6% discount to the A$15.70 analyst price target range.
Explore the SWS fair ratio for Premier Investments.
Result: Price-to-earnings of 12.3x (UNDERVALUED)
Still, the sharp 1 year total shareholder return decline, along with weaker recent sales and profit figures, leaves Premier Investments exposed if trading conditions or consumer demand soften further.
Find out about the key risks to this Premier Investments narrative.
Another view on Premier Investments' value
The P/E argument for Premier Investments points clearly to value, yet the SWS DCF model paints an even stronger picture. At A$11.16, the stock trades below an estimated future cash flow value of A$18.11, which also suggests undervaluation, although through a very different lens.
DCF work leans heavily on long term cash flow assumptions, discount rates and terminal values. If those inputs prove too optimistic, that A$18.11 figure leaves less margin than it appears. If they hold up, the gap to the current price raises a simple question: Is the market being too pessimistic about Premier Investments, or is the model too generous?
Look into how the SWS DCF model arrives at its fair value.
Simply Wall St performs a discounted cash flow (DCF) on every stock in the world every day (check out Premier Investments for example). We show the entire calculation in full. You can track the result in your watchlist or portfolio and be alerted when this changes, or use our stock screener to discover 6 high quality undervalued stocks. If you save a screener we even alert you when new companies match - so you never miss a potential opportunity.
Next Steps
Mixed signals around Premier Investments can create noise, so it helps to move quickly and ground your view in the full picture of risks and potential upsides. To pressure test both sides of the story, review the 4 key rewards and 1 important warning sign.
Looking for more investment ideas beyond Premier Investments?
If Premier Investments is on your radar, you may want to consider scanning fresh opportunities across different styles before the next wave of money moves first.
- Target income stability by reviewing a shortlist of stocks that have paid investors consistently through thick and thin with the 3 dividend fortresses.
- Hunt for resilient balance sheets by filtering for companies that pair manageable debt with strong fundamentals using the list of solid balance sheet and fundamentals (12 results).
- Spot potential early movers by checking a focused 16 high quality undiscovered gems that many investors may not be watching yet.
This article by Simply Wall St is general in nature. We provide commentary based on historical data and analyst forecasts only using an unbiased methodology and our articles are not intended to be financial advice. It does not constitute a recommendation to buy or sell any stock, and does not take account of your objectives, or your financial situation. We aim to bring you long-term focused analysis driven by fundamental data. Note that our analysis may not factor in the latest price-sensitive company announcements or qualitative material. Simply Wall St has no position in any stocks mentioned.
Have feedback on this article? Concerned about the content? Get in touch with us directly. Alternatively, email editorial-team@simplywallst.com